Philips 2015 Annual Report Download - page 134
Download and view the complete annual report
Please find page 134 of the 2015 Philips annual report below. You can navigate through the pages in the report by either clicking on the pages listed below, or by using the keyword search tool below to find specific information within the annual report.-
 1
1 -
2
-
3
-
4
-
5
-
6
-
7
-
8
-
9
-
10
-
11
-
12
-
13
-
14
-
15
-
16
-
17
-
18
-
19
-
20
-
21
-
22
-
23
-
24
-
25
-
26
-
27
-
28
-
29
-
30
-
31
-
32
-
33
-
34
-
35
-
36
-
37
-
38
-
39
-
40
-
41
-
42
-
43
-
44
-
45
-
46
-
47
-
48
-
49
-
50
-
51
-
52
-
53
-
54
-
55
-
56
-
57
-
58
-
59
-
60
-
61
-
62
-
63
-
64
-
65
-
66
-
67
-
68
-
69
-
70
-
71
-
72
-
73
-
74
-
75
-
76
-
77
-
78
-
79
-
80
-
81
-
82
-
83
-
84
-
85
-
86
-
87
-
88
-
89
-
90
-
91
-
92
-
93
-
94
-
95
-
96
-
97
-
98
-
99
-
100
-
101
-
102
-
103
-
104
-
105
-
106
-
107
-
108
-
109
-
110
-
111
-
112
-
113
-
114
-
115
-
116
-
117
-
118
-
119
-
120
-
121
-
122
-
123
-
 124
124 -
 125
125 -
 126
126 -
 127
127 -
 128
128 -
 129
129 -
 130
130 -
 131
131 -
 132
132 -
 133
133 -
 134
134 -
 135
135 -
 136
136 -
 137
137 -
 138
138 -
 139
139 -
 140
140 -
 141
141 -
 142
142 -
 143
143 -
 144
144 -
145
-
146
-
147
-
148
-
149
-
150
-
151
-
152
-
153
-
154
-
155
-
156
-
157
-
158
-
159
-
160
-
161
-
162
-
163
-
164
-
165
-
166
-
167
-
168
-
169
-
170
-
171
-
172
-
173
-
174
-
175
-
176
-
177
-
178
-
179
-
180
-
181
-
182
-
183
-
184
-
185
-
186
-
187
-
188
-
189
-
190
-
191
-
192
-
193
-
194
-
195
-
196
-
197
-
198
-
199
-
200
-
201
-
202
-
203
-
204
-
205
-
206
-
207
-
208
-
209
-
210
-
211
-
212
-
213
-
214
-
215
-
216
-
217
-
218
-
219
-
220
-
221
-
222
-
223
-
224
-
225
-
226
-
227
-
228
-
229
-
230
-
231
-
232
-
233
-
234
-
235
-
236
-
237
-
238
 |
 |

Group nancial statements 12.9 9
134 Annual Report 2015
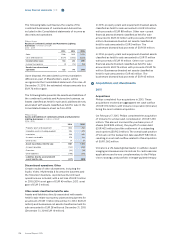
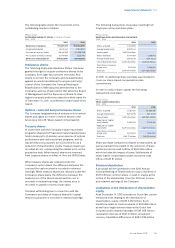
assessed to mitigate tax uncertainties in the future to
the extent possible. Examples of tax uncertainties are:
applicability of participation exemptions, allocation
issues, and issues related to (non-)deductibility.
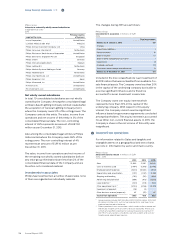
Tax uncertainties due to permanent
establishments
In countries where Philips starts new operations or
alters business models, the issue of permanent
establishment may arise. This is because when
operations in a country involves a Philips organization
in another country, there is a risk that tax claims will
arise in the former country as well as in the latter
country.
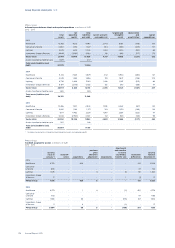
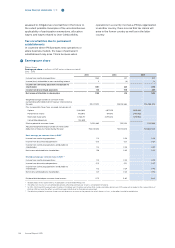
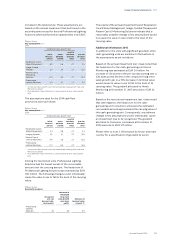
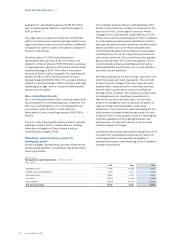
9Earnings per share
Philips Group
Earnings per share in millions of EUR unless otherwise stated1)
2013 - 2015
2013 2014 2015
Income from continuing operations 1,034 221 414
Income (loss) attributable to non-controlling interest 3 (4) 14
Income from continuing operations attributable to
shareholders 1,031 225 400
Income from discontinued operations 138 190 245
Net income attributable to shareholders 1,169 415 645
Weighted average number of common shares
outstanding (after deduction of treasury shares) during
the year 911,071,970 915,192,683 916,086,943
Plus incremental shares from assumed conversions of:
Options 5,464,833 4,617,109 3,565,682
Performance shares 662,973 614,010 2,479,923
Restricted share rights 4,768,777 2,290,472 1,491,960
Convertible debentures 103,899
Dilutive potential common shares 11,000,482 7,521,591 7,537,565
Adjusted weighted average number of shares (after
deduction of treasury shares) during the year 922,072,452 922,714,274 923,624,508
Basic earnings per common share in EUR2)
Income from continuing operations 1.13 0.24 0.45
Income from discontinued operations 0.15 0.21 0.27
Income from continuing operations attributable to
shareholders 1.13 0.25 0.44
Net income attributable to shareholders 1.28 0.45 0.70
Diluted earnings per common share in EUR2,3,4)
Income from continuing operations 1.12 0.24 0.45
Income from discontinued operations 0.15 0.21 0.27
Income from continuing operations attributable to
shareholders 1.12 0.24 0.43
Net income attributable to shareholders 1.27 0.45 0.70
Dividend distributed per common share in euros 0.75 0.80 0.80
1) Shareholders in this table refer to shareholders of Koninklijke Philips N.V.
2) The eect on income of convertible debentures aecting earnings per share is considered immaterial
3) In 2015, 2014 and 2013, respectively 12 million, 19 million and 14 million securities that could potentially dilute basic EPS were not included in the computation of
dilutive EPS because the eect would have been antidilutive for the periods presented
4) The dilutive potential common shares are not taken into account in the periods for which there is a loss, as the eect would be antidilutive