Philips 2015 Annual Report Download - page 4
Download and view the complete annual report
Please find page 4 of the 2015 Philips annual report below. You can navigate through the pages in the report by either clicking on the pages listed below, or by using the keyword search tool below to find specific information within the annual report.-
 1
1 -
 2
2 -
 3
3 -
 4
4 -
 5
5 -
 6
6 -
 7
7 -
 8
8 -
 9
9 -
 10
10 -
 11
11 -
 12
12 -
 13
13 -
 14
14 -
 15
15 -
16
-
17
-
18
-
19
-
20
-
21
-
22
-
23
-
24
-
25
-
26
-
27
-
28
-
29
-
30
-
31
-
32
-
33
-
34
-
35
-
36
-
37
-
38
-
39
-
40
-
41
-
42
-
43
-
44
-
45
-
46
-
47
-
48
-
49
-
50
-
51
-
52
-
53
-
54
-
55
-
56
-
57
-
58
-
59
-
60
-
61
-
62
-
63
-
64
-
65
-
66
-
67
-
68
-
69
-
70
-
71
-
72
-
73
-
74
-
75
-
76
-
77
-
78
-
79
-
80
-
81
-
82
-
83
-
84
-
85
-
86
-
87
-
88
-
89
-
90
-
91
-
92
-
93
-
94
-
95
-
96
-
97
-
98
-
99
-
100
-
101
-
102
-
103
-
104
-
105
-
106
-
107
-
108
-
109
-
110
-
111
-
112
-
113
-
114
-
115
-
116
-
117
-
118
-
119
-
120
-
121
-
122
-
123
-
124
-
125
-
126
-
127
-
128
-
129
-
130
-
131
-
132
-
133
-
134
-
135
-
136
-
137
-
138
-
139
-
140
-
141
-
142
-
143
-
144
-
145
-
146
-
147
-
148
-
149
-
150
-
151
-
152
-
153
-
154
-
155
-
156
-
157
-
158
-
159
-
160
-
161
-
162
-
163
-
164
-
165
-
166
-
167
-
168
-
169
-
170
-
171
-
172
-
173
-
174
-
175
-
176
-
177
-
178
-
179
-
180
-
181
-
182
-
183
-
184
-
185
-
186
-
187
-
188
-
189
-
190
-
191
-
192
-
193
-
194
-
195
-
196
-
197
-
198
-
199
-
200
-
201
-
202
-
203
-
204
-
205
-
206
-
207
-
208
-
209
-
210
-
211
-
212
-
213
-
214
-
215
-
216
-
217
-
218
-
219
-
220
-
221
-
222
-
223
-
224
-
225
-
226
-
227
-
228
-
229
-
230
-
231
-
232
-
233
-
234
-
235
-
236
-
237
-
238
 |
 |

Performance highlights 1
4 Annual Report 2015
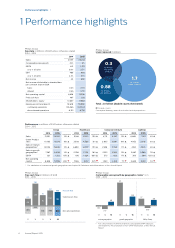
1 Performance highlights
Philips Group
Key data in millions of EUR unless otherwise stated
2014 - 2015
2014 2015
Sales 21,391 24,244
Comparable sales growth (1)% 2%
EBITA 821 1,372
as a % of sales 3.8% 5.7%
EBIT 486 992
as a % of sales 2.3% 4.1%
Net income 411 659
Net income attributable to shareholders
per common share in EUR:
basic 0.45 0.70
diluted 0.45 0.70
Net operating capital 8,838 11,096
Free cash ow 497 325
Shareholders’ equity 10,867 11,662
Employees at December 31 113,678 112,959
continuing operations 105,365 104,204
discontinued operations 8,313 8,755
Philips Group
Lives improved in billions
0.3
by Philips
well-being
products
0.88
by Philips
care products
1.7
by Philips
Green Products
Total: 2.0 billion (double counts eliminated)
Double counts
Conceptual drawing, areas do not reect actual proportions
Performance in millions of EUR unless otherwise stated
2014 - 2015
Group Healthcare Consumer Lifestyle Lighting
2014 2015 2014 2015 2014 2015 2014 2015
Sales 21,391 24,244 13% 9,186 10,912 19% 4,731 5,347 13% 6,869 7,411 8%
Green Product
sales 11,065 13,014 18% 3,508 4,580 31% 2,605 3,091 19% 4,952 5,343 8%
Sales in mature
geographies1) 14,004
15,836
13% 6,890 8,207 19% 2,508 2,784 11% 4,182 4,425 6%
Sales in growth
geographies1) 7,387 8,408 14% 2,296 2,705 18% 2,223 2,563 15% 2,687 2,986 11%
EBITA 821 1,372 67% 616 1,024 66% 573 673 17% 293 594 103%
Net operating
capital 8,838 11,096 26% 7,565 9,212 22% 1,353 1,453 7% 3,638 3,813 5%
1) For a denition of mature and growth geographies see chapter 18, Denitions and abbreviations, of this Annual Report
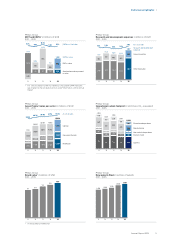
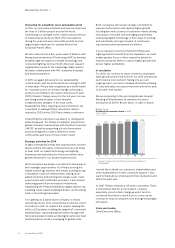
Philips Group
Free cash ow in millions of EUR
2011 - 2015
610
(663)
(53)
‘11
1,886
(241)
1,645
‘12
912
(830)
82
‘13
1,303
(806)
497
‘14
1,167
Operating cash flows
(842) Net capital expenditures
325 Free cash flow
‘15
Philips Group
Comparable sales growth by geographic cluster1) in %
2013 - 2015
(0.3)
‘13
(1.3)
‘14
1.5
‘15
mature geographies
8.9
‘13
0
‘14
3.5
‘15
growth geographies
2.7
‘13
(0.9)
‘14
2.2
‘15
Philips Group
1) For a reconciliation to the most directly comparable GAAP measures,
see chapter 15, Reconciliation of non-GAAP information, of this Annual
Report