Philips 2015 Annual Report Download - page 203
Download and view the complete annual report
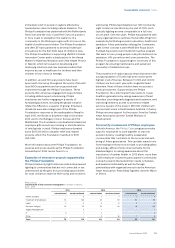
Please find page 203 of the 2015 Philips annual report below. You can navigate through the pages in the report by either clicking on the pages listed below, or by using the keyword search tool below to find specific information within the annual report.-
 1
1 -
2
-
3
-
4
-
5
-
6
-
7
-
8
-
9
-
10
-
11
-
12
-
13
-
14
-
15
-
16
-
17
-
18
-
19
-
20
-
21
-
22
-
23
-
24
-
25
-
26
-
27
-
28
-
29
-
30
-
31
-
32
-
33
-
34
-
35
-
36
-
37
-
38
-
39
-
40
-
41
-
42
-
43
-
44
-
45
-
46
-
47
-
48
-
49
-
50
-
51
-
52
-
53
-
54
-
55
-
56
-
57
-
58
-
59
-
60
-
61
-
62
-
63
-
64
-
65
-
66
-
67
-
68
-
69
-
70
-
71
-
72
-
73
-
74
-
75
-
76
-
77
-
78
-
79
-
80
-
81
-
82
-
83
-
84
-
85
-
86
-
87
-
88
-
89
-
90
-
91
-
92
-
93
-
94
-
95
-
96
-
97
-
98
-
99
-
100
-
101
-
102
-
103
-
104
-
105
-
106
-
107
-
108
-
109
-
110
-
111
-
112
-
113
-
114
-
115
-
116
-
117
-
118
-
119
-
120
-
121
-
122
-
123
-
124
-
125
-
126
-
127
-
128
-
129
-
130
-
131
-
132
-
133
-
134
-
135
-
136
-
137
-
138
-
139
-
140
-
141
-
142
-
143
-
144
-
145
-
146
-
147
-
148
-
149
-
150
-
151
-
152
-
153
-
154
-
155
-
156
-
157
-
158
-
159
-
160
-
161
-
162
-
163
-
164
-
165
-
166
-
167
-
168
-
169
-
170
-
171
-
172
-
173
-
174
-
175
-
176
-
177
-
178
-
179
-
180
-
181
-
182
-
183
-
184
-
185
-
186
-
187
-
188
-
189
-
190
-
191
-
192
-
 193
193 -
 194
194 -
 195
195 -
 196
196 -
 197
197 -
 198
198 -
 199
199 -
 200
200 -
 201
201 -
 202
202 -
 203
203 -
 204
204 -
 205
205 -
 206
206 -
 207
207 -
 208
208 -
 209
209 -
 210
210 -
 211
211 -
 212
212 -
 213
213 -
214
-
215
-
216
-
217
-
218
-
219
-
220
-
221
-
222
-
223
-
224
-
225
-
226
-
227
-
228
-
229
-
230
-
231
-
232
-
233
-
234
-
235
-
236
-
237
-
238
 |
 |

Sustainability statements 14.3.2
Annual Report 2015 203
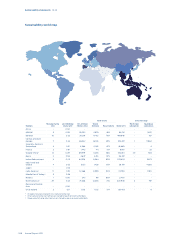
restoration activities including biodiversity restoration
projects with social components, sustainable
development, and poverty relief.
The Philips Biodiversity policy was issued in 2014 and
progress was made on biodiversity management, both
on sites (e.g. impact measurement), on natural capital
valuation and on the management level. Most
initiatives were led by the Philips Leaders for Nature
(LFN) team, site management, local sustainability
organizations worldwide and Group Sustainability in
Eindhoven, the Netherlands. We continued our global
partnership with the International Union for the
Conservation of Nature (IUCN) Netherlands Committee
and our participation in the IUCN LFN program which
brings companies, NGOs and governments together to
work on the topic of business and biodiversity. Next, we
made intensive use of the internal company-wide
social network platform to create and share activities
and achievements including training programs.
In 2014, a biodiversity impact assessment was
performed for all our industrial sites, using the geo-
locations of these sites and the Integrated Biodiversity
Assessment Tool (IBAT). For every industrial site the
nearest Key Biodiversity Area or IUCN protected area
was determined as well as the distance to such area.
The results of our assessment for all industrial sites can
be found here: GRI Biodiversity.
Philips participated in 2015 in the development of the
Natural Capital Protocol and volunteered as a pilot
company. These activities will continue in 2016. The
environmental impact of Philips itself is limited as the
company is not very energy-intensive and does not
emit large quantities of high-impact substances. The
impact of our supply chain however is signicantly
higher than our own impact. For this reason, we used
the identied hot-spots in our supply chain as input for
our CDP Supply Chain program. More information on
that program can be found at sub-section 14.2.8,
Supplier indicators, of this Annual Report. In this Annual
Report, Philips has also followed the IIRC Integrated
Reporting <IR> framework which includes natural
capital as a source of value creation. Together with the
WBCSD we are further developing the EP&L concept
and methodology, including environmental benets.
14.3.3 Green Operations
Our Green Operations program, related to improving
the environmental performance of our manufacturing
facilities, focuses on most contributors to climate
change, but also addresses water, recycling of waste
and chemical substances.
For an overview of Philips’ industrial sites, please go
here: Philips industrial sites.
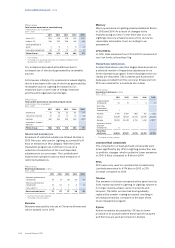
Philips Group
Green Operations in % unless otherwise stated
2015
2007
baseline year
2015
target1)
2015
actual1)
Total CO2 from
manufacturing
883 kilotonnes
CO2 -equivalent (25) (58)
Water 4.0 million m3 (10) (32)
Materials provided for
recycling via external
contractor per total waste 79 80 83
Restricted substances:
Benzene emission 52 kg (50) (65)
Mercury emission 185 kg (100) (96)
CFCs, HCFCs 156 kg (100) (100)
Hazardous substances
Lead emission 1,838 kg (100) (100)
PFCs 1,534 kg (35) (100)
Toluene emission 2,210 kg (90) (93)
Xylene emission 4,502 kg (90) 345
Styrene 80,526 kg (90) (94)
Antimony, Arsenic and
their compounds 18 kg (100) (100)
1) Against the base year 2007
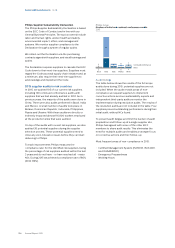
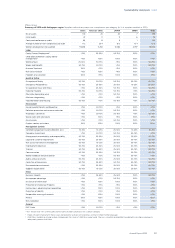
Energy use in manufacturing
Total energy usage in manufacturing amounted to
9,702 terajoules in 2015, of which Lighting consumed
about 70%. Compared to 2014, energy consumption at
Philips went down by 14%. This was driven by a
decrease in activities in high energy-intensive
operations in Lighting, organizational changes, and
energy eciency improvements, partly oset by one
manufacturing site reporting for the rst time. The
energy use of our discontinued operations amounted
to 2,179 terajoules in 2015 (2014: 2,160 terajoules).
Philips Group
Total energy consumption in manufacturing in terajoules
2011 - 2015
2011 2012 2013 2014 2015
Healthcare 1,541 1,798 1,794 1,773 1,808
Consumer Lifestyle 1,252 1,104 1,142 1,115 1,131
Lighting 9,237 9,112 9,027 8,369 6,763
Innovation, Group &
Services - - - - -
Philips Group 12,030 12,014 11,963 11,257 9,702
Carbon emissions in manufacturing
The greenhouse gas emissions of our manufacturing
operations totaled 371 kilotonnes CO2-equivalent in
2015, 21% lower than in 2014. This is the result of the
decreased energy usage related to decreased
production and operational changes. Indirect CO2
emissions decreased overall, mainly due to decreased
usage of electricity at various Lighting sites. The carbon
emissions of our discontinued operations amounted to
145 kilotonnes CO2-equivalent in 2015 (2014: 141
kilotonnes CO2-equivalent).