Philips 2015 Annual Report Download - page 57
Download and view the complete annual report
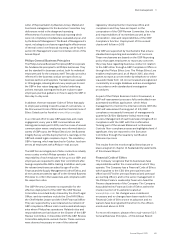
Please find page 57 of the 2015 Philips annual report below. You can navigate through the pages in the report by either clicking on the pages listed below, or by using the keyword search tool below to find specific information within the annual report.-
 1
1 -
2
-
3
-
4
-
5
-
6
-
7
-
8
-
9
-
10
-
11
-
12
-
13
-
14
-
15
-
16
-
17
-
18
-
19
-
20
-
21
-
22
-
23
-
24
-
25
-
26
-
27
-
28
-
29
-
30
-
31
-
32
-
33
-
34
-
35
-
36
-
37
-
38
-
39
-
40
-
41
-
42
-
43
-
44
-
45
-
46
-
 47
47 -
 48
48 -
 49
49 -
 50
50 -
 51
51 -
 52
52 -
 53
53 -
 54
54 -
 55
55 -
 56
56 -
 57
57 -
 58
58 -
 59
59 -
 60
60 -
 61
61 -
 62
62 -
 63
63 -
 64
64 -
 65
65 -
 66
66 -
 67
67 -
68
-
69
-
70
-
71
-
72
-
73
-
74
-
75
-
76
-
77
-
78
-
79
-
80
-
81
-
82
-
83
-
84
-
85
-
86
-
87
-
88
-
89
-
90
-
91
-
92
-
93
-
94
-
95
-
96
-
97
-
98
-
99
-
100
-
101
-
102
-
103
-
104
-
105
-
106
-
107
-
108
-
109
-
110
-
111
-
112
-
113
-
114
-
115
-
116
-
117
-
118
-
119
-
120
-
121
-
122
-
123
-
124
-
125
-
126
-
127
-
128
-
129
-
130
-
131
-
132
-
133
-
134
-
135
-
136
-
137
-
138
-
139
-
140
-
141
-
142
-
143
-
144
-
145
-
146
-
147
-
148
-
149
-
150
-
151
-
152
-
153
-
154
-
155
-
156
-
157
-
158
-
159
-
160
-
161
-
162
-
163
-
164
-
165
-
166
-
167
-
168
-
169
-
170
-
171
-
172
-
173
-
174
-
175
-
176
-
177
-
178
-
179
-
180
-
181
-
182
-
183
-
184
-
185
-
186
-
187
-
188
-
189
-
190
-
191
-
192
-
193
-
194
-
195
-
196
-
197
-
198
-
199
-
200
-
201
-
202
-
203
-
204
-
205
-
206
-
207
-
208
-
209
-
210
-
211
-
212
-
213
-
214
-
215
-
216
-
217
-
218
-
219
-
220
-
221
-
222
-
223
-
224
-
225
-
226
-
227
-
228
-
229
-
230
-
231
-
232
-
233
-
234
-
235
-
236
-
237
-
238
 |
 |

Sector performance 6.3.2
Annual Report 2015 57
Hazardous Substances (RoHS), Registration,
Evaluation, Authorization and Restriction of Chemicals
(REACH), Energy-using Products (EuP) and Energy
Performance of Buildings (EPBD) directives.
With regard to sourcing, please refer to sub-section
14.2.8, Supplier indicators, of this Annual Report.
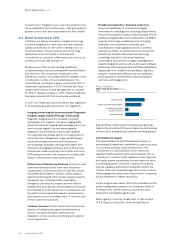
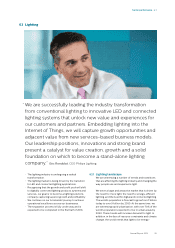
6.3.3 2015 business highlights
In 2015, our lighting innovations supported our six
strategic priorities aimed at delivering even greater
value for our customers and other stakeholders. These
highlights showcase our leading innovations in
connected lighting, systems and services, our
aspiration to be the lighting company for the Internet of
Things for both professional and consumer markets.
Philips expanded its portfolio of connected lighting
products for the home by introducing Philips Hue
Phoenix, a luminaire providing tunable white light,
Philips Hue Go, a portable wireless luminaire, Philips
Lightstrip Plus, a exible LED light strip, and a new
bridge enabling Philips Hue to interact with other Apple
HomeKit devices and become voice-controlled.
Philips and Cisco formed a global strategic alliance that
will help enable facilities managers, building owners
and oce workers to reap the benets of the Internet
of Things in oces. The alliance combines Philips’
connected oce lighting system with Cisco’s highly
secure network technology, to increase energy
eciency, provide data to optimize user comfort and
improve the oce environment.
Philips made further inroads with its Philips CityTouch
lighting system, with Los Angeles adopting an
advanced Philips management system that uses
wireless and cloud-based technologies to control its
street lighting. Philips’ CityTouch connected lighting
management system is now used in more than 262
projects in over 30 countries across the world.
In Lille, France, Carrefour installed 2.5 kilometers of
Philips LED lighting that uses light to transmit a location
signal to a shopper’s smartphone, triggering an app to
provide location-based services. This enables
Carrefour to provide new services to its shoppers, such
as helping them to navigate and nd promotions across
the 7,800 m2 shop oor. It is the world’s largest
connected lighting indoor positioning system for retail
and has reduced the total lighting-based electricity
consumption of the hypermarket by 50%.
Philips provided a connected LED lighting system for
the New NY Bridge in New York. It will combine roadway
and architectural lighting, an industry rst, on what will
be the most technologically advanced bridge in North
America. The system will feature remotely programmed
lights that produce dynamic colorful eects and use
Philips ActiveSite and Philips CityTouch cloud-based
monitoring and management systems.
Philips continues to light up iconic buildings around the
world with colorful and dynamic connected LED
lighting. New illuminations in 2015 include Europe’s
largest mosque located in Moscow, Le Meurice hotel in
Paris, the Cairo Opera House, the Accra Theater in
Ghana, the Big Four Bridge in Louisville, US, the Nanjing
Tower in China, and the Edirne Bridge and Buttery
Valley in Turkey.
Philips launched LifeLight, a solar-powered LED
lighting range for homes in Kenya and other African
countries. The range eliminates the need to use
kerosene lamps, with their harmful fumes, in homes in
o-grid areas, and also increases productivity and
community life by enabling activities to continue after
dark.
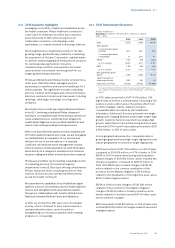
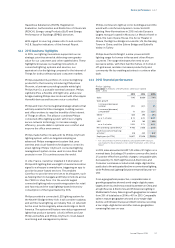
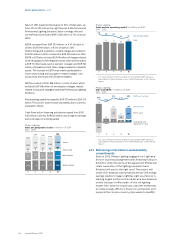
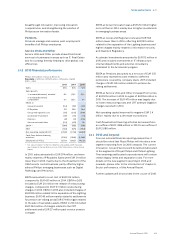
6.3.4 2015 nancial performance
Philips Lighting
Key data in millions of EUR unless otherwise stated
2013 - 2015
2013 2014 2015
Sales 7,145 6,869 7,411
Sales growth
% increase (decrease),
nominal (2)% (4)% 8%
% increase (decrease),
comparable1) 1% (3)% (3)%
EBITA 1) 580 293 594
as a % of sales 8.1% 4.3% 8.0%
EBIT 413 185 486
as a % of sales 5.8% 2.7% 6.6%
Net operating capital (NOC)1) 4,462 3,638 3,813
Cash ows before nancing
activities1) 418 442 642
Employees (in FTEs) 38,671 37,808 33,618
1) For a reconciliation to the most directly comparable GAAP measures,
see chapter 15, Reconciliation of non-GAAP information, of this Annual
Report
In 2015, sales amounted to EUR 7,411 million, 8% higher on a
nominal basis. Excluding a 9% positive currency effect and a
2% positive effect from portfolio changes, comparable sales
decreased by 3%. Both Light Sources & Electronics and
Consumer Luminaires recorded a mid-single-digit decline,
partly due to the anticipated decline in conventional lighting,
while Professional Lighting Solutions remained flat year-on-
year.
From a geographical perspective, comparable sales in
growth geographies showed a mid-single-digit decrease,
largely driven by declines across all businesses in China and
at Light Sources & Electronics and Professional Lighting in
Middle East & Turkey. Sales in growth geographies increased
from 39% of total sales in 2014 to 40% in 2015. Comparable
sales in mature geographies showed a low-single-digit
decline, with Western Europe and North America recording
a low-single-digit decline and other mature geographies
remaining flat year-on-year.