Philips 2015 Annual Report Download - page 167
Download and view the complete annual report
Please find page 167 of the 2015 Philips annual report below. You can navigate through the pages in the report by either clicking on the pages listed below, or by using the keyword search tool below to find specific information within the annual report.-
 1
1 -
2
-
3
-
4
-
5
-
6
-
7
-
8
-
9
-
10
-
11
-
12
-
13
-
14
-
15
-
16
-
17
-
18
-
19
-
20
-
21
-
22
-
23
-
24
-
25
-
26
-
27
-
28
-
29
-
30
-
31
-
32
-
33
-
34
-
35
-
36
-
37
-
38
-
39
-
40
-
41
-
42
-
43
-
44
-
45
-
46
-
47
-
48
-
49
-
50
-
51
-
52
-
53
-
54
-
55
-
56
-
57
-
58
-
59
-
60
-
61
-
62
-
63
-
64
-
65
-
66
-
67
-
68
-
69
-
70
-
71
-
72
-
73
-
74
-
75
-
76
-
77
-
78
-
79
-
80
-
81
-
82
-
83
-
84
-
85
-
86
-
87
-
88
-
89
-
90
-
91
-
92
-
93
-
94
-
95
-
96
-
97
-
98
-
99
-
100
-
101
-
102
-
103
-
104
-
105
-
106
-
107
-
108
-
109
-
110
-
111
-
112
-
113
-
114
-
115
-
116
-
117
-
118
-
119
-
120
-
121
-
122
-
123
-
124
-
125
-
126
-
127
-
128
-
129
-
130
-
131
-
132
-
133
-
134
-
135
-
136
-
137
-
138
-
139
-
140
-
141
-
142
-
143
-
144
-
145
-
146
-
147
-
148
-
149
-
150
-
151
-
152
-
153
-
154
-
155
-
156
-
 157
157 -
 158
158 -
 159
159 -
 160
160 -
 161
161 -
 162
162 -
 163
163 -
 164
164 -
 165
165 -
 166
166 -
 167
167 -
 168
168 -
 169
169 -
 170
170 -
 171
171 -
 172
172 -
 173
173 -
 174
174 -
 175
175 -
 176
176 -
 177
177 -
178
-
179
-
180
-
181
-
182
-
183
-
184
-
185
-
186
-
187
-
188
-
189
-
190
-
191
-
192
-
193
-
194
-
195
-
196
-
197
-
198
-
199
-
200
-
201
-
202
-
203
-
204
-
205
-
206
-
207
-
208
-
209
-
210
-
211
-
212
-
213
-
214
-
215
-
216
-
217
-
218
-
219
-
220
-
221
-
222
-
223
-
224
-
225
-
226
-
227
-
228
-
229
-
230
-
231
-
232
-
233
-
234
-
235
-
236
-
237
-
238
 |
 |
Group nancial statements 12.9
Annual Report 2015 167
uctuations may impact Philips’ nancial results.
Philips is exposed to currency risk in the following
areas:
• Transaction exposures, related to anticipated sales
and purchases and on-balance-sheet receivables/
payables resulting from such transactions
• Translation exposure of foreign-currency
intercompany and external debt and deposits
•Translation exposure of net income in foreign entities
• Translation exposure of foreign-currency-
denominated equity invested in consolidated
companies
• Translation exposure to equity interests in non-
functional-currency investments in associates and
available-for-sale nancial assets.
It is Philips’ policy to reduce the potential year on year
volatility caused by foreign-currency movements on its
net earnings by hedging the anticipated net exposure
of foreign currencies resulting from foreign-currency
sales and purchases. In general net anticipated
exposures for the Group are hedged during a period of
15 months in layers of 20% up to a maximum hedge of
80%, using forwards and currency options. Philips’
policy requires signicant committed foreign currency
exposures to be fully hedged, generally using forwards.
However not every foreign currency can or shall be
hedged as there may be regulatory barriers or
prohibitive hedging cost preventing Philips from
eectively and/or eciently hedging its currency
exposures. As a result, hedging activities cannot and
will not eliminate all currency risks for anticipated and
committed transaction exposures.
During 2015 Philips has changed its hedging policy with
regard to anticipated transaction exposures. The
previous hedging policy focused on protecting against
changes in value of forecasted individual transactions
and cash ows. Under the previous policy the hedging
ratio and period were set by individual businesses
based on their ability to forecast cash ows, the time
horizon for the cash ows and their ability to adapt to
changing levels of foreign currency rates. Existing
hedges under the old policy are continued until they
mature against the original forecasted transactional
exposures.
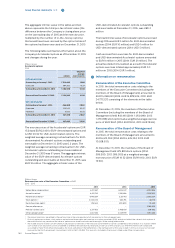
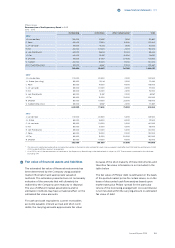
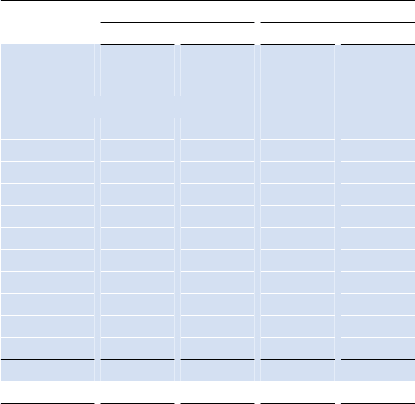
The following table outlines the estimated nominal
value in millions of EUR for transaction exposure and
related hedges for Philips’ most signicant currency
exposures consolidated as of December 31, 2015:
Philips Group
Estimated transaction exposure and related hedges
in millions of EUR
2015
Receivables Payables
exposure hedges exposure hedges
Balance as of
December 31,
2015
Exposure currency
USD 1,691 (1,329) (1,297) 1,120
GBP 473 (267) (39) 26
JPY 473 (283) (25) 22
CAD 199 (86) (13) 11
AUD 165 (90) (2) 1
CHF 143 (74) (2) 1
PLN 112 (90) (14) 14
SEK 77 (42) (5) 2
CNY 63 (63) (358) 200
DKK 42 (22) - -
Others 777 (603) (204) 131
Total 2015 4,215 (2,949) (1,959) 1,528
Total 2014 5,557 (3,800) (2,277) 1,492
The derivatives related to transactions are, for hedge
accounting purposes, split into hedges of on-balance-
sheet accounts receivable/payable and forecasted
sales and purchases. Changes in the value of on-
balance-sheet foreign-currency accounts receivable/
payable, as well as the changes in the fair value of the
hedges related to these exposures, are reported in the
income statement under costs of sales. Hedges related
to forecasted transactions, where hedge accounting is
applied, are accounted for as cash ow hedges. The
results from such hedges are deferred in other
comprehensive income within equity to the extent that
the hedge is eective. As of December 31, 2015, a gain
of EUR 12 million was deferred in equity as a result of
these hedges. The result deferred in equity will be
released to earnings mostly during 2016 at the time
when the related hedged transactions aect the
income statement. During 2015, a net loss of EUR 2
million was recorded in the consolidated statement of
income as a result of ineectiveness on certain
anticipated cash ow hedges.
The total net fair value of hedges related to transaction
exposure as of December 31, 2015 was an unrealized
asset of EUR 17 million. An instantaneous 10% increase
in the value of the EUR against all currencies would lead
to an increase of EUR 66 million in the value of the
derivatives; including a EUR 25 million increase related
to foreign exchange transactions of USD against EUR, a
EUR 18 million increase related to foreign exchange
transactions of the GBP against euro, a EUR 14 million
increase related to foreign exchange transactions of the
JPY and a EUR 7 million increase related to PLN. This