Philips 2015 Annual Report Download - page 221
Download and view the complete annual report
Please find page 221 of the 2015 Philips annual report below. You can navigate through the pages in the report by either clicking on the pages listed below, or by using the keyword search tool below to find specific information within the annual report.-
 1
1 -
2
-
3
-
4
-
5
-
6
-
7
-
8
-
9
-
10
-
11
-
12
-
13
-
14
-
15
-
16
-
17
-
18
-
19
-
20
-
21
-
22
-
23
-
24
-
25
-
26
-
27
-
28
-
29
-
30
-
31
-
32
-
33
-
34
-
35
-
36
-
37
-
38
-
39
-
40
-
41
-
42
-
43
-
44
-
45
-
46
-
47
-
48
-
49
-
50
-
51
-
52
-
53
-
54
-
55
-
56
-
57
-
58
-
59
-
60
-
61
-
62
-
63
-
64
-
65
-
66
-
67
-
68
-
69
-
70
-
71
-
72
-
73
-
74
-
75
-
76
-
77
-
78
-
79
-
80
-
81
-
82
-
83
-
84
-
85
-
86
-
87
-
88
-
89
-
90
-
91
-
92
-
93
-
94
-
95
-
96
-
97
-
98
-
99
-
100
-
101
-
102
-
103
-
104
-
105
-
106
-
107
-
108
-
109
-
110
-
111
-
112
-
113
-
114
-
115
-
116
-
117
-
118
-
119
-
120
-
121
-
122
-
123
-
124
-
125
-
126
-
127
-
128
-
129
-
130
-
131
-
132
-
133
-
134
-
135
-
136
-
137
-
138
-
139
-
140
-
141
-
142
-
143
-
144
-
145
-
146
-
147
-
148
-
149
-
150
-
151
-
152
-
153
-
154
-
155
-
156
-
157
-
158
-
159
-
160
-
161
-
162
-
163
-
164
-
165
-
166
-
167
-
168
-
169
-
170
-
171
-
172
-
173
-
174
-
175
-
176
-
177
-
178
-
179
-
180
-
181
-
182
-
183
-
184
-
185
-
186
-
187
-
188
-
189
-
190
-
191
-
192
-
193
-
194
-
195
-
196
-
197
-
198
-
199
-
200
-
201
-
202
-
203
-
204
-
205
-
206
-
207
-
208
-
209
-
210
-
 211
211 -
 212
212 -
 213
213 -
 214
214 -
 215
215 -
 216
216 -
 217
217 -
 218
218 -
 219
219 -
 220
220 -
 221
221 -
 222
222 -
 223
223 -
 224
224 -
 225
225 -
 226
226 -
 227
227 -
 228
228 -
 229
229 -
 230
230 -
 231
231 -
232
-
233
-
234
-
235
-
236
-
237
-
238
 |
 |
Reconciliation of non-GAAP information 15
Annual Report 2015 221
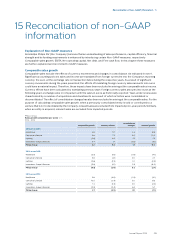
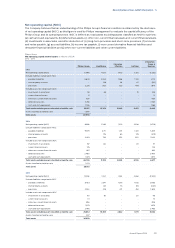
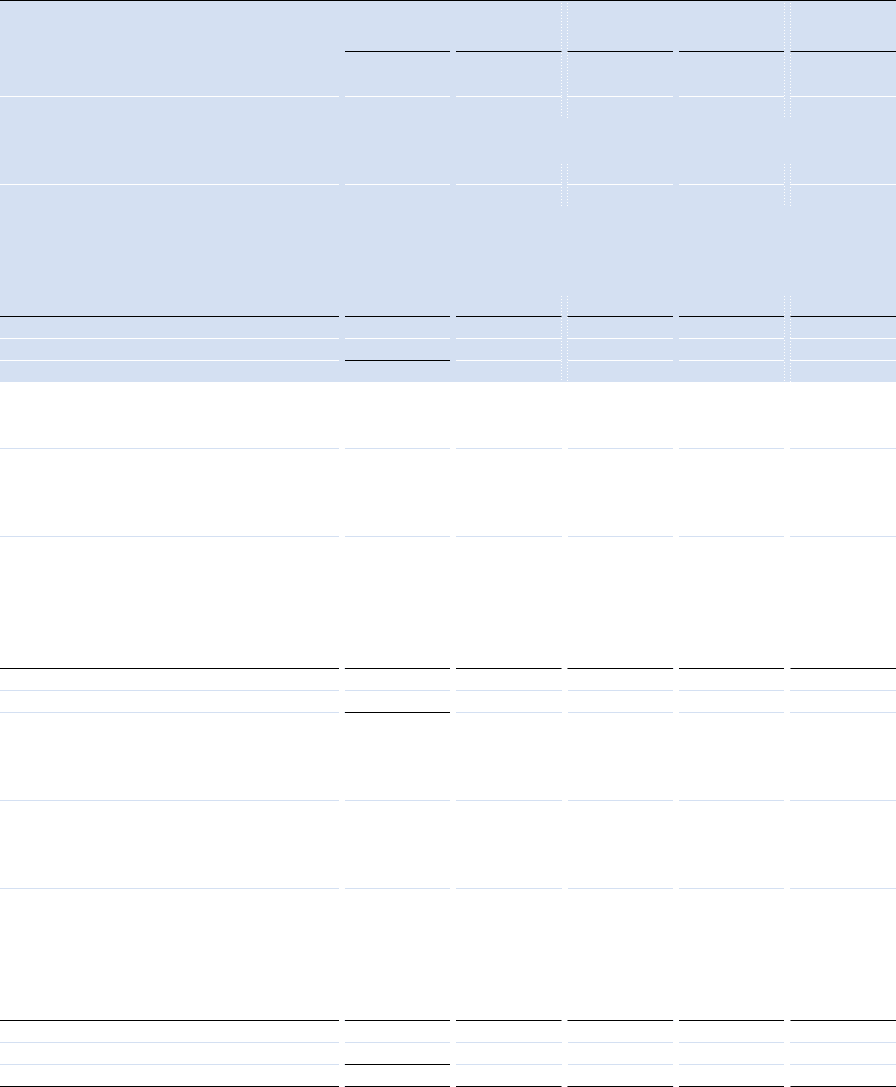
Net operating capital (NOC)
The Company believes that an understanding of the Philips Group’s nancial condition is enhanced by the disclosure
of net operating capital (NOC), as this gure is used by Philips’ management to evaluate the capital eciency of the
Philips Group and its operating sectors. NOC is dened as: total assets excluding assets classied as held for sale less:
(a) cash and cash equivalents, (b) deferred tax assets, (c) other non-current nancial assets and current nancial assets,
(d) investments in associates, and after deduction of: (e) long-term provisions and short-term provisions, (f) accounts
and notes payable, (g) accrued liabilities, (h) income tax payable, (i) non-current derivative nancial liabilities and
derivative nancial liabilities and (j) other non-current liabilities and other current liabilities.
Philips Group
Net operating capital to total assets in millions of EUR
2013 - 2015
Philips Group Healthcare
Consumer
Lifestyle Lighting
Innovation,
Group &
Services
2015
Net operating capital (NOC) 11,096 9,212 1,453 3,813 (3,382)
Exclude liabilities comprised in NOC:
- payables/liabilities 9,640 3,064 1,356 1,510 3,710
- intercompany accounts - 128 36 87 (251)
- provisions 3,225 903 235 446 1,641
Include assets not comprised in NOC:
- investments in associates 181 56 - 19 106
- current nancial assets 12 - - - 12
- other non-current nancial assets 489 - - - 489
- deferred tax assets 2,758 - - - 2,758
- cash and cash equivalents 1,766 - - - 1,766
Total assets excluding assets classied as held for sale 29,167 13,363 3,080 5,875 6,849
Assets classied as held for sale 1,809
Total assets 30,976
2014
Net operating capital (NOC) 8,838 7,565 1,353 3,638 (3,718)
Exclude liabilities comprised in NOC:
- payables/liabilities 9,379 2,711 1,411 1,422 3,835
- intercompany accounts - 125 65 129 (319)
- provisions 3,445 793 220 530 1,902
Include assets not comprised in NOC:
- investments in associates 157 80 - 20 57
- current nancial assets 125 - - - 125
- other non-current nancial assets 462 - - - 462
- deferred tax assets 2,460 - - - 2,460
- cash and cash equivalents 1,873 - - - 1,873
Total assets excluding assets classied as held for sale 26,739 11,274 3,049 5,739 6,677
Assets classied as held for sale 1,613
Total assets 28,352
2013
Net operating capital (NOC) 10,238 7,437 1,261 4,462 (2,922)
Exclude liabilities comprised in NOC:
- payables/ liabilities 8,453 2,541 1,275 1,672 2,965
- intercompany accounts - 124 75 105 (304)
- provisions 2,554 278 221 452 1,603
Include assets not comprised in NOC:
- investments in associates 161 85 - 20 56
- current nancial assets 10 - - - 10
- other non-current nancial assets 496 - - - 496
- deferred tax assets 1,675 - - - 1,675
- cash and cash equivalents 2,465 - - - 2,465
Total assets excluding assets classied as held for sale 26,052 10,465 2,832 6,711 6,044
Assets classied as held for sale 507
Total assets 26,559