Philips 2015 Annual Report Download - page 220
Download and view the complete annual report
Please find page 220 of the 2015 Philips annual report below. You can navigate through the pages in the report by either clicking on the pages listed below, or by using the keyword search tool below to find specific information within the annual report.-
 1
1 -
2
-
3
-
4
-
5
-
6
-
7
-
8
-
9
-
10
-
11
-
12
-
13
-
14
-
15
-
16
-
17
-
18
-
19
-
20
-
21
-
22
-
23
-
24
-
25
-
26
-
27
-
28
-
29
-
30
-
31
-
32
-
33
-
34
-
35
-
36
-
37
-
38
-
39
-
40
-
41
-
42
-
43
-
44
-
45
-
46
-
47
-
48
-
49
-
50
-
51
-
52
-
53
-
54
-
55
-
56
-
57
-
58
-
59
-
60
-
61
-
62
-
63
-
64
-
65
-
66
-
67
-
68
-
69
-
70
-
71
-
72
-
73
-
74
-
75
-
76
-
77
-
78
-
79
-
80
-
81
-
82
-
83
-
84
-
85
-
86
-
87
-
88
-
89
-
90
-
91
-
92
-
93
-
94
-
95
-
96
-
97
-
98
-
99
-
100
-
101
-
102
-
103
-
104
-
105
-
106
-
107
-
108
-
109
-
110
-
111
-
112
-
113
-
114
-
115
-
116
-
117
-
118
-
119
-
120
-
121
-
122
-
123
-
124
-
125
-
126
-
127
-
128
-
129
-
130
-
131
-
132
-
133
-
134
-
135
-
136
-
137
-
138
-
139
-
140
-
141
-
142
-
143
-
144
-
145
-
146
-
147
-
148
-
149
-
150
-
151
-
152
-
153
-
154
-
155
-
156
-
157
-
158
-
159
-
160
-
161
-
162
-
163
-
164
-
165
-
166
-
167
-
168
-
169
-
170
-
171
-
172
-
173
-
174
-
175
-
176
-
177
-
178
-
179
-
180
-
181
-
182
-
183
-
184
-
185
-
186
-
187
-
188
-
189
-
190
-
191
-
192
-
193
-
194
-
195
-
196
-
197
-
198
-
199
-
200
-
201
-
202
-
203
-
204
-
205
-
206
-
207
-
208
-
209
-
 210
210 -
 211
211 -
 212
212 -
 213
213 -
 214
214 -
 215
215 -
 216
216 -
 217
217 -
 218
218 -
 219
219 -
 220
220 -
 221
221 -
 222
222 -
 223
223 -
 224
224 -
 225
225 -
 226
226 -
 227
227 -
 228
228 -
 229
229 -
 230
230 -
231
-
232
-
233
-
234
-
235
-
236
-
237
-
238
 |
 |

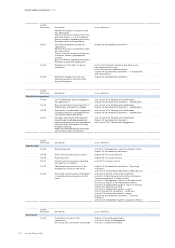
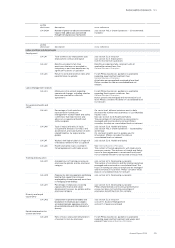
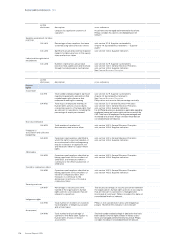
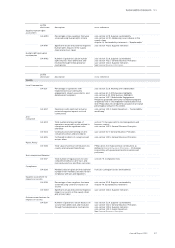
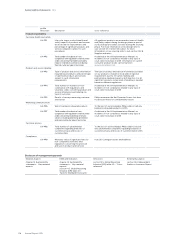
Reconciliation of non-GAAP information 15
220 Annual Report 2015
Philips Group
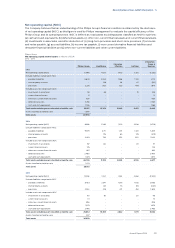
Sales growth composition per geographic cluster in %
2013 - 2015
comparable growth currency eects
consolidation
changes nominal growth
2015 versus 2014
Western Europe 1.3 1.9 0.7 3.9
North America 1.4 18.4 1.4 21.2
Other mature geographies 2.7 5.3 3.7 11.7
Mature geographies 1.5 10.2 1.4 13.1
Growth geographies 3.5 7.9 2.4 13.8
Philips Group 2.2 9.4 1.7 13.3
2014 versus 2013
Western Europe (0.9) 0.4 0.2 (0.3)
North America (1.8) (0.9) (0.3) (3.0)
Other mature geographies (0.9) (4.7) 0.0 (5.6)
Mature geographies (1.3) (0.8) (0.1) (2.2)
Growth geographies 0.0 (4.4) 0.7 (3.7)
Philips Group (0.9) (2.0) 0.2 (2.7)
2013 versus 2012
Western Europe 0.0 (0.6) 0.5 (0.1)
North America (2.9) (3.1) (0.2) (6.2)
Other mature geographies 10.1 (13.5) 0.0 (3.4)
Mature geographies (0.3) (3.3) 0.1 (3.5)
Growth geographies 8.9 (5.1) 0.0 3.8
Philips Group 2.7 (3.9) 0.1 (1.1)
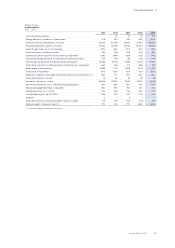
EBITA
The Company uses the term EBIT and EBITA to evaluate the performance of the Philips Group and its operating sectors.
The term EBIT has the same meaning as Income from operations (IFO). Referencing EBITA will make the underlying
performance of our businesses more transparent by excluding the amortization and impairment on intangible assets
(excluding software and capitalized development expenses). As a consequence EBITA represents income from
operations before amortization and impairment of intangible assets generated in acquisitions.
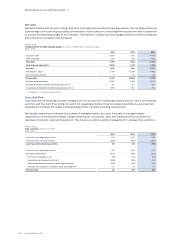
Philips Group
EBITA to Income from operations (or EBIT) in millions of EUR
2013 - 2015
Philips Group Healthcare
Consumer
Lifestyle Lighting
Innovation,
Group & Services
2015
EBITA 1,372 1,024 673 594 (919)
Amortization of intangible assets1) (380) (205) (52) (108) (15)
Impairment of goodwill - - - - -
Income from operations (or EBIT) 992 819 621 486 (934)
2014
EBITA 821 616 573 293 (661)
Amortization of intangible assets1) (332) (159) (53) (106) (14)
Impairment of goodwill (3) (1) - (2) -
Income from operations (or EBIT) 486 456 520 185 (675)
2013
EBITA 2,276 1,512 483 580 (299)
Amortization of intangible assets1) (393) (195) (54) (141) (3)
Impairment of goodwill (28) (2) - (26) -
Income from operations (or EBIT) 1,855 1,315 429 413 (302)
1) Excluding amortization of software and product development.