Philips 2015 Annual Report Download - page 29
Download and view the complete annual report
Please find page 29 of the 2015 Philips annual report below. You can navigate through the pages in the report by either clicking on the pages listed below, or by using the keyword search tool below to find specific information within the annual report.-
 1
1 -
2
-
3
-
4
-
5
-
6
-
7
-
8
-
9
-
10
-
11
-
12
-
13
-
14
-
15
-
16
-
17
-
18
-
 19
19 -
 20
20 -
 21
21 -
 22
22 -
 23
23 -
 24
24 -
 25
25 -
 26
26 -
 27
27 -
 28
28 -
 29
29 -
 30
30 -
 31
31 -
 32
32 -
 33
33 -
 34
34 -
 35
35 -
 36
36 -
 37
37 -
 38
38 -
 39
39 -
40
-
41
-
42
-
43
-
44
-
45
-
46
-
47
-
48
-
49
-
50
-
51
-
52
-
53
-
54
-
55
-
56
-
57
-
58
-
59
-
60
-
61
-
62
-
63
-
64
-
65
-
66
-
67
-
68
-
69
-
70
-
71
-
72
-
73
-
74
-
75
-
76
-
77
-
78
-
79
-
80
-
81
-
82
-
83
-
84
-
85
-
86
-
87
-
88
-
89
-
90
-
91
-
92
-
93
-
94
-
95
-
96
-
97
-
98
-
99
-
100
-
101
-
102
-
103
-
104
-
105
-
106
-
107
-
108
-
109
-
110
-
111
-
112
-
113
-
114
-
115
-
116
-
117
-
118
-
119
-
120
-
121
-
122
-
123
-
124
-
125
-
126
-
127
-
128
-
129
-
130
-
131
-
132
-
133
-
134
-
135
-
136
-
137
-
138
-
139
-
140
-
141
-
142
-
143
-
144
-
145
-
146
-
147
-
148
-
149
-
150
-
151
-
152
-
153
-
154
-
155
-
156
-
157
-
158
-
159
-
160
-
161
-
162
-
163
-
164
-
165
-
166
-
167
-
168
-
169
-
170
-
171
-
172
-
173
-
174
-
175
-
176
-
177
-
178
-
179
-
180
-
181
-
182
-
183
-
184
-
185
-
186
-
187
-
188
-
189
-
190
-
191
-
192
-
193
-
194
-
195
-
196
-
197
-
198
-
199
-
200
-
201
-
202
-
203
-
204
-
205
-
206
-
207
-
208
-
209
-
210
-
211
-
212
-
213
-
214
-
215
-
216
-
217
-
218
-
219
-
220
-
221
-
222
-
223
-
224
-
225
-
226
-
227
-
228
-
229
-
230
-
231
-
232
-
233
-
234
-
235
-
236
-
237
-
238
 |
 |
Group performance 5.1.12
Annual Report 2015 29
In 2014, Philips announced the start of the process to
combine the Lumileds and Automotive Lighting
businesses into a stand-alone company and explore
strategic options to attract capital from third-party
investors for this combined business.
As announced on January 22, 2016, Philips and GO
Scale Capital have withdrawn their ling with the
Committee of Foreign Investment in the United States
(CFIUS) and terminated the agreement pursuant to
which the consortium led by GO Scale Capital would
acquire an 80.1% interest in the combined businesses
of Lumileds and Automotive. Despite the parties’
extensive eorts to mitigate CFIUS’ concern, regulatory
clearance has not been granted for this particular
transaction. Philips is actively discussing the sale of the
business with potential buyers and expects a
transaction to be completed in the year 2016.
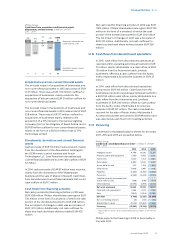
Income from discontinued operations increased by
EUR 55 million to EUR 245 million in 2015. The year-on-
year increase was mainly due to the positive impact
from the treatment of depreciation and amortization of
assets held for sale. Income from discontinued
operations mainly consisted of net income of EUR 246
million related to the combined businesses of Lumileds
and Automotive and a net loss of EUR 1 million, mainly
related to the Audio, Video, Multimedia & Accessories
and Television business.
For further information, refer to note 3, Discontinued
operations and other assets classied as held for sale.
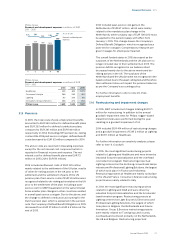
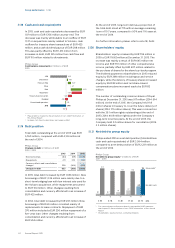
5.1.12 Net income
Net income increased from EUR 411 million in 2014 to
EUR 659 million in 2015. The increase was largely due
to higher EBIT of EUR 506 million and net income from
discontinued operations of EUR 55 million, partly oset
by higher income tax charges of EUR 213 million and
lower results from investments in associates of EUR 32
million.
Basic earnings per common share from net income
attributable to shareholders increased from EUR 0.45
per common share in 2014 to EUR 0.70 per common
share in 2015.
5.1.13 Acquisitions and divestments
Acquisitions
In 2015, Philips completed four acquisitions, the largest
were Volcano Corporation, an image-guided therapy
company based in the United States, and Blue Jay
Consulting, a leading provider of hospital emergency
room consulting services. Acquisitions in 2015 and prior
years led to post-merger integration charges of EUR 107
million in Healthcare and EUR 5 million in Lighting.
In 2014, Philips acquired Unisensor, a Danish healthcare
company, and a 51% interest in General Lighting
Company (GLC) based in the Kingdom of Saudi Arabia.
Philips also purchased some minor magnetic
resonance imaging (MRI) activities from Hologic, a US
healthcare company. Acquisitions in 2014 and prior
years led to post-merger integration charges of EUR 1
million in Healthcare, EUR 1 million in Consumer
Lifestyle and EUR 19 million in Lighting.
In 2013, there were four minor acquisitions. Acquisitions
in 2013 and prior years led to post-merger integration
charges of EUR 6 million in Healthcare, EUR 4 million in
Consumer Lifestyle EUR, and 6 million in Lighting.
Divestments
In 2015, Philips completed seven divestments, which
include, the sale of Assembléon Holding B.V., OEM
Remote Controls, Axsun Technologies LLC, and several
small businesses within Healthcare and Lighting.
In 2014, Philips completed the divestment of its
Lifestyle Entertainment activities to Gibson Brands Inc.
Philips also completed two other divestments of
business activities which related to Healthcare and
Lighting activities.
In 2013, Philips completed several divestments of
business activities, mainly related to certain Healthcare
activities.
For details, please refer to
note 4, Acquisitions and
divestments
.
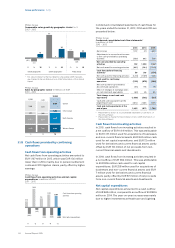
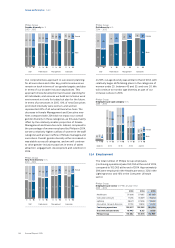
5.1.14 Performance by geographic cluster
In 2015, sales increased 13% nominally, largely due to
favorable foreign exchange impacts, and 2% on a
comparable basis, driven by Healthcare and Consumer
Lifestyle.
Sales in mature geographies were EUR 1,832 million
higher than in 2014, or 1% higher on a comparable basis.
Sales in Western Europe were 1% higher than in 2014,
with growth at Healthcare and Consumer Lifestyle
partly oset by a decline at Lighting. Sales in North
America increased by EUR 1,417 million, or 1% on a
comparable basis. Comparable sales in other mature
geographies showed a 3% increase, with growth at
Healthcare and Consumer Lifestyle, while Lighting was
in line with 2014.
In growth geographies, sales increased by EUR 1,021
million, or 4% on a comparable basis, with high-single-
digit growth at Consumer Lifestyle and Healthcare,
partly oset by a mid-single digit decline at Lighting.
Double-digit growth in Central & Eastern Europe and
high-single-digit growth in Asia Pacic and India were
partly oset by at growth year-on-year in China.