Philips 2015 Annual Report Download - page 28
Download and view the complete annual report
Please find page 28 of the 2015 Philips annual report below. You can navigate through the pages in the report by either clicking on the pages listed below, or by using the keyword search tool below to find specific information within the annual report.-
 1
1 -
2
-
3
-
4
-
5
-
6
-
7
-
8
-
9
-
10
-
11
-
12
-
13
-
14
-
15
-
16
-
17
-
 18
18 -
 19
19 -
 20
20 -
 21
21 -
 22
22 -
 23
23 -
 24
24 -
 25
25 -
 26
26 -
 27
27 -
 28
28 -
 29
29 -
 30
30 -
 31
31 -
 32
32 -
 33
33 -
 34
34 -
 35
35 -
 36
36 -
 37
37 -
 38
38 -
39
-
40
-
41
-
42
-
43
-
44
-
45
-
46
-
47
-
48
-
49
-
50
-
51
-
52
-
53
-
54
-
55
-
56
-
57
-
58
-
59
-
60
-
61
-
62
-
63
-
64
-
65
-
66
-
67
-
68
-
69
-
70
-
71
-
72
-
73
-
74
-
75
-
76
-
77
-
78
-
79
-
80
-
81
-
82
-
83
-
84
-
85
-
86
-
87
-
88
-
89
-
90
-
91
-
92
-
93
-
94
-
95
-
96
-
97
-
98
-
99
-
100
-
101
-
102
-
103
-
104
-
105
-
106
-
107
-
108
-
109
-
110
-
111
-
112
-
113
-
114
-
115
-
116
-
117
-
118
-
119
-
120
-
121
-
122
-
123
-
124
-
125
-
126
-
127
-
128
-
129
-
130
-
131
-
132
-
133
-
134
-
135
-
136
-
137
-
138
-
139
-
140
-
141
-
142
-
143
-
144
-
145
-
146
-
147
-
148
-
149
-
150
-
151
-
152
-
153
-
154
-
155
-
156
-
157
-
158
-
159
-
160
-
161
-
162
-
163
-
164
-
165
-
166
-
167
-
168
-
169
-
170
-
171
-
172
-
173
-
174
-
175
-
176
-
177
-
178
-
179
-
180
-
181
-
182
-
183
-
184
-
185
-
186
-
187
-
188
-
189
-
190
-
191
-
192
-
193
-
194
-
195
-
196
-
197
-
198
-
199
-
200
-
201
-
202
-
203
-
204
-
205
-
206
-
207
-
208
-
209
-
210
-
211
-
212
-
213
-
214
-
215
-
216
-
217
-
218
-
219
-
220
-
221
-
222
-
223
-
224
-
225
-
226
-
227
-
228
-
229
-
230
-
231
-
232
-
233
-
234
-
235
-
236
-
237
-
238
 |
 |

Group performance 5.1.7
28 Annual Report 2015
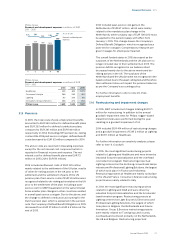
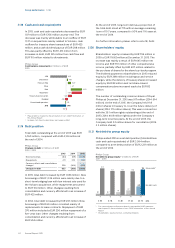
Healthcare mainly took place in the US and the
Netherlands. Consumer Lifestyle restructuring projects
were mainly in the Netherlands.
For further information on restructuring, refer to note 19,
Provisions.
Philips Group
Restructuring and related charges in millions of EUR
2013 - 2015
2013 2014 2015
Restructuring and related charges per
sector:
Healthcare (6) 68 61
Consumer Lifestyle 10 8 37
Lighting 77 225 93
Innovation, Group & Services 3 113 (20)
Continuing operations 84 414 171
Discontinued operations 33 18 5
Cost breakdown of restructuring and
related charges:
Personnel lay-o costs 95 354 194
Release of provision (62) (36) (88)
Restructuring-related asset
impairment 25 57 46
Other restructuring-related costs 26 39 19
Continuing operations 84 414 171
Discontinued operations 33 18 5
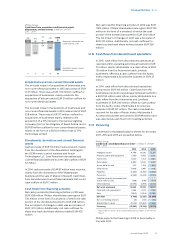
5.1.7 Financial income and expenses
A breakdown of Financial income and expenses is
presented in the table below.
Philips Group
Financial income and expenses in millions of EUR
2013 - 2015
2013 2014 2015
Interest expense (net) (269) (251) (302)
Sale of securities - 60 20
Impairments (10) (17) (46)
Other (51) (93) (41)
Financial income and expenses (330) (301) (369)
Net interest expense in 2015 was EUR 51 million higher
than in 2014, mainly due to a weaker euro against the
US dollar in relation to interest expenses on USD bonds.
The gain from the sale of stakes in 2015 amounted to
EUR 20 million, mainly from Assembléon Technologies
B.V., Silicon & Software Systems and other equity
interest.
Impairments amounted to EUR 46 million mainly due
to valuation allowances.
Other nancial expense amounted to EUR 41 million in
2015, primarily consisting of interest expense related to
the jury verdict in the Masimo litigation, and accretion
expense associated with other discounted provisions.
For further information, refer to note 7, Financial income
and expenses.
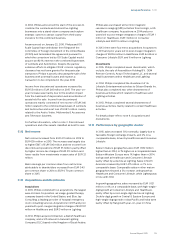
5.1.8 Income taxes
Income taxes amounted to EUR 239 million, compared
to EUR 26 million in 2014. The eective income tax rate
in 2015 was 38.4%, compared to 14.1% in 2014. The
increase was mainly due to a signicant change in the
geographical mix of actual prots and the absence of
various items that reduced the charge in the prior year,
in particular favorable tax regulations relating to R&D
investments in 2014.
For 2016, we expect our eective tax rate to be in the
30% to 35% range. However, the actual rate will depend
on the geographical mix of actual prots.
For further information, refer to note 8, Income taxes.
5.1.9 Results of investments in associates
Philips Group
Results of investments in associates in millions of EUR
2013 - 2015
2013 2014 2015
Company’s participation in income 5 30 10
Investment impairment and other items (30) - 19
Dilution gain - 32 1
Results of Investments in associates (25) 62 30
Results related to investments in associates decreased
from a gain of EUR 62 million in 2014 to a gain of EUR
30 million in 2015. 2015 included proceeds from the sale
of Assembléon Technologies B.V., while 2014 included
a EUR 32 million dilution gain related to Philips’ stake
in Corindus Vascular Robotics.
The Company’s participation in income decreased from
EUR 30 million in 2014 to EUR 10 million in 2015. The
gain in 2015 was mainly attributable to the results of
Philips Medical Capital.
For further information, refer to note 5, Interests in
entities.
5.1.10 Non-controlling interests
Net income attributable to non-controlling interests
amounted to a gain of EUR 14 million in 2015, compared
to a loss of EUR 4 million in 2014.
5.1.11 Discontinued operations
Discontinued operations consist primarily of the
combined businesses of Lumileds and Automotive, the
Audio, Video, Multimedia & Accessories business, and
the Television business. The results related to these
businesses are reported under Discontinued
operations in the Consolidated statements of income
and Consolidated statements of cash ows.