Philips 2015 Annual Report Download - page 149
Download and view the complete annual report
Please find page 149 of the 2015 Philips annual report below. You can navigate through the pages in the report by either clicking on the pages listed below, or by using the keyword search tool below to find specific information within the annual report.-
 1
1 -
2
-
3
-
4
-
5
-
6
-
7
-
8
-
9
-
10
-
11
-
12
-
13
-
14
-
15
-
16
-
17
-
18
-
19
-
20
-
21
-
22
-
23
-
24
-
25
-
26
-
27
-
28
-
29
-
30
-
31
-
32
-
33
-
34
-
35
-
36
-
37
-
38
-
39
-
40
-
41
-
42
-
43
-
44
-
45
-
46
-
47
-
48
-
49
-
50
-
51
-
52
-
53
-
54
-
55
-
56
-
57
-
58
-
59
-
60
-
61
-
62
-
63
-
64
-
65
-
66
-
67
-
68
-
69
-
70
-
71
-
72
-
73
-
74
-
75
-
76
-
77
-
78
-
79
-
80
-
81
-
82
-
83
-
84
-
85
-
86
-
87
-
88
-
89
-
90
-
91
-
92
-
93
-
94
-
95
-
96
-
97
-
98
-
99
-
100
-
101
-
102
-
103
-
104
-
105
-
106
-
107
-
108
-
109
-
110
-
111
-
112
-
113
-
114
-
115
-
116
-
117
-
118
-
119
-
120
-
121
-
122
-
123
-
124
-
125
-
126
-
127
-
128
-
129
-
130
-
131
-
132
-
133
-
134
-
135
-
136
-
137
-
138
-
 139
139 -
 140
140 -
 141
141 -
 142
142 -
 143
143 -
 144
144 -
 145
145 -
 146
146 -
 147
147 -
 148
148 -
 149
149 -
 150
150 -
 151
151 -
 152
152 -
 153
153 -
 154
154 -
 155
155 -
 156
156 -
 157
157 -
 158
158 -
 159
159 -
160
-
161
-
162
-
163
-
164
-
165
-
166
-
167
-
168
-
169
-
170
-
171
-
172
-
173
-
174
-
175
-
176
-
177
-
178
-
179
-
180
-
181
-
182
-
183
-
184
-
185
-
186
-
187
-
188
-
189
-
190
-
191
-
192
-
193
-
194
-
195
-
196
-
197
-
198
-
199
-
200
-
201
-
202
-
203
-
204
-
205
-
206
-
207
-
208
-
209
-
210
-
211
-
212
-
213
-
214
-
215
-
216
-
217
-
218
-
219
-
220
-
221
-
222
-
223
-
224
-
225
-
226
-
227
-
228
-
229
-
230
-
231
-
232
-
233
-
234
-
235
-
236
-
237
-
238
 |
 |
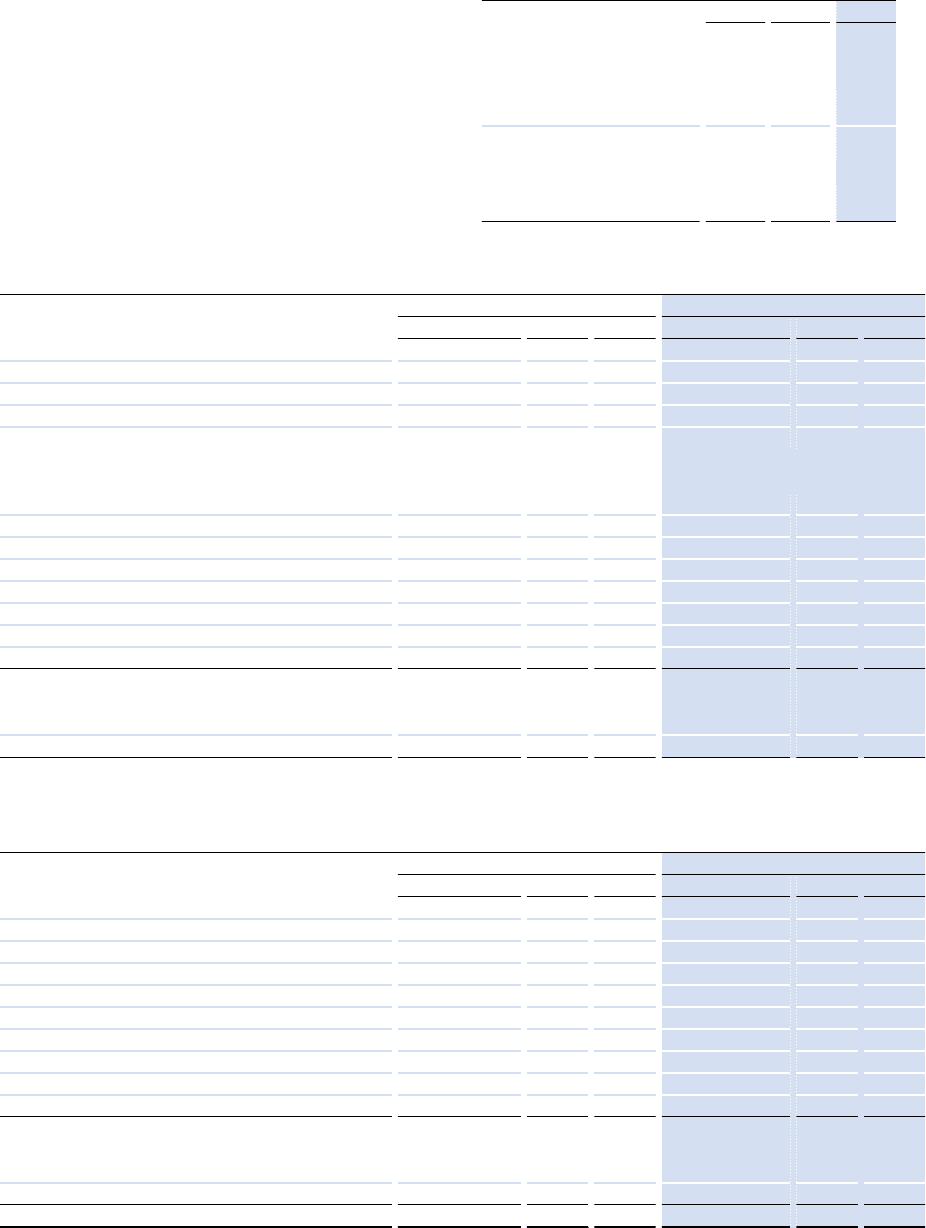
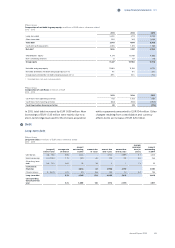
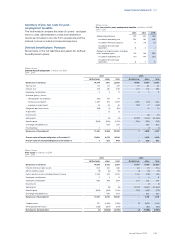
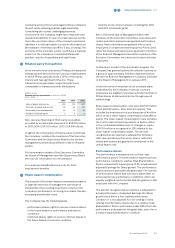
Group nancial statements 12.9
Annual Report 2015 149
Summary of pre-tax costs for post-
employment benets
The below table contains the total of current- and past
service costs, administration costs and settlement
results as included in Income from operations and the
interest cost as included in Financial expenses.
Dened benet plans: Pensions
Movements in the net liabilities and assets for dened
benet pension plans:
Philips Group
Pre-tax costs for post-employment benets in millions of EUR
2013 - 2015
2013 2014 2015
Dened-benet plans 297 245 561
included in operating cost 220 182 487
included in nancial expense 71 59 72
included in discontinued
operations 6 4 2
Dened-contribution plans including
multi-employer plans 142 148 299
included in operating cost 134 144 293
included in discontinued
operations 8 4 6
Philips Group
Dened-benet obligations in millions of EUR
2014 - 2015
2014 2015
Netherlands other total Netherlands other total
Balance as of January 1 14,294 7,911 22,205 17,616 9,465 27,081
Service cost 174 65 239 77 60 137
Interest cost 478 361 839 120 345 465
Employee contributions 5 4 9 5 4 9
Actuarial (gains) / losses
- demographic assumptions (80) 197 117 - - -
-nancial assumptions 3,487 782 4,269 1,796 (271) 1,525
- experience adjustment 23 25 48 (176) 27 (149)
(Negative) past service cost (68) (1) (69) - 14 14
Acquisitions - 12 12 - - -
Divestments - - - - (12) (12)
Settlements - (9) (9) (19,197) (5,193) (24,390)
Benets paid (699) (506) (1,205) (234) (553) (787)
Exchange rate dierences - 624 624 635 635
Miscellaneous 2 - 2 - (1) (1)
Balance as of December 31 17,616 9,465 27,081 7 4,520 4,527
Present value of funded obligations at December 31 17,609 8,532 26,141 - 3,635 3,635
Present value of unfunded obligations at December 31 7 933 940 7 885 892
Philips Group
Plan assets in millions of EUR
2014 - 2015
2014 2015
Netherlands other total Netherlands other total
Balance as of January 1 14,843 6,728 21,571 17,847 8,016 25,863
Interest income on plan assets 508 330 838 123 311 434
Admin expenses paid (9) (6) (15) (3) (6) (9)
Return on plan assets excluding interest income 2,534 674 3,208 1,233 (315) 918
Employee contributions 5 4 9 5 4 9
Employer contributions 665 199 864 245 302 547
Divestments - - - - (7) (7)
Settlements - (8) (8) (19,217) (5,623) (24,840)
Benets paid (699) (445) (1,144) (233) (492) (725)
Exchange rate dierences - 540 540 - 520 520
Balance as of December 31 17,847 8,016 25,863 - 2,710 2,710
Funded status 231 (1,449) (1,218) (7) (1,810) (1,817)
Unrecognized net assets (238) (554) (792) - (90) (90)
Net balance sheet position (7) (2,003) (2,010) (7) (1,900) (1,907)