Philips 2015 Annual Report Download - page 230
Download and view the complete annual report
Please find page 230 of the 2015 Philips annual report below. You can navigate through the pages in the report by either clicking on the pages listed below, or by using the keyword search tool below to find specific information within the annual report.-
 1
1 -
2
-
3
-
4
-
5
-
6
-
7
-
8
-
9
-
10
-
11
-
12
-
13
-
14
-
15
-
16
-
17
-
18
-
19
-
20
-
21
-
22
-
23
-
24
-
25
-
26
-
27
-
28
-
29
-
30
-
31
-
32
-
33
-
34
-
35
-
36
-
37
-
38
-
39
-
40
-
41
-
42
-
43
-
44
-
45
-
46
-
47
-
48
-
49
-
50
-
51
-
52
-
53
-
54
-
55
-
56
-
57
-
58
-
59
-
60
-
61
-
62
-
63
-
64
-
65
-
66
-
67
-
68
-
69
-
70
-
71
-
72
-
73
-
74
-
75
-
76
-
77
-
78
-
79
-
80
-
81
-
82
-
83
-
84
-
85
-
86
-
87
-
88
-
89
-
90
-
91
-
92
-
93
-
94
-
95
-
96
-
97
-
98
-
99
-
100
-
101
-
102
-
103
-
104
-
105
-
106
-
107
-
108
-
109
-
110
-
111
-
112
-
113
-
114
-
115
-
116
-
117
-
118
-
119
-
120
-
121
-
122
-
123
-
124
-
125
-
126
-
127
-
128
-
129
-
130
-
131
-
132
-
133
-
134
-
135
-
136
-
137
-
138
-
139
-
140
-
141
-
142
-
143
-
144
-
145
-
146
-
147
-
148
-
149
-
150
-
151
-
152
-
153
-
154
-
155
-
156
-
157
-
158
-
159
-
160
-
161
-
162
-
163
-
164
-
165
-
166
-
167
-
168
-
169
-
170
-
171
-
172
-
173
-
174
-
175
-
176
-
177
-
178
-
179
-
180
-
181
-
182
-
183
-
184
-
185
-
186
-
187
-
188
-
189
-
190
-
191
-
192
-
193
-
194
-
195
-
196
-
197
-
198
-
199
-
200
-
201
-
202
-
203
-
204
-
205
-
206
-
207
-
208
-
209
-
210
-
211
-
212
-
213
-
214
-
215
-
216
-
217
-
218
-
219
-
 220
220 -
 221
221 -
 222
222 -
 223
223 -
 224
224 -
 225
225 -
 226
226 -
 227
227 -
 228
228 -
 229
229 -
 230
230 -
 231
231 -
 232
232 -
 233
233 -
 234
234 -
 235
235 -
 236
236 -
 237
237 -
 238
238
 |
 |

Investor Relations 17.3
230 Annual Report 2015
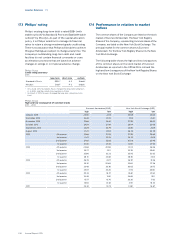
17.3 Philips’ rating
Philips’ existing long-term debt is rated BBB+ (with
stable outlook)1)
by Standard & Poor’s and Baa1 (with stable
outlook)
2) by Moody’s. As part of the capital allocation
policy, it is Philips’ ambition to manage its nancial
ratios to retain a strong investment grade credit rating.
There is no assurance that Philips will be able to achieve
this goal. Ratings are subject to change at any time. The
Company’s outstanding long-term debt and credit
facilities do not contain nancial covenants or cross
acceleration provisions that are based on adverse
changes in ratings or on material adverse change.
Philips Group
Credit rating summary
2015
long-term short-term outlook
Standard & Poor’s BBB+1) A-2 Stable1)
Moody’s Baa12) P-2 Stable
1) On July 28, 2015, Standard & Poor’s changed the long-term rating from
A- to BBB+ and the outlook from negative to stable
2) On March 17, 2015, Moody’s changed the long-term rating from A3 to
Baa1
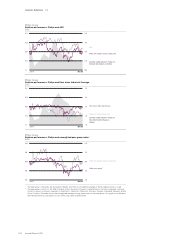
17.4 Performance in relation to market
indices
The common shares of the Company are listed on the stock
market of Euronext Amsterdam. The New York Registry
Shares of the Company, representing common shares of the
Company, are listed on the New York Stock Exchange. The
principal market for the common shares is Euronext
Amsterdam. For the New York Registry Shares it is the New
York Stock Exchange.
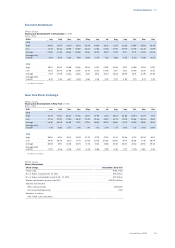
The following table shows the high and low closing prices
of the common shares on the stock market of Euronext
Amsterdam as reported in the Ocial Price List and the
high and low closing prices of the New York Registry Shares
on the New York Stock Exchange:
Philips Group
High and low closing price of common shares
2011 - 2016
Euronext Amsterdam (EUR) New York Stock Exchange (USD)
high low high low
January, 2016 24.50 22.15 26.68 24.04
December, 2015 25.49 23.19 27.14 25.41
November, 2015 25.88 24.40 27.29 26.05
October, 2015 24.59 21.09 26.94 23.66
September, 2015 23.29 20.79 25.86 23.19
August, 2015 25.71 21.94 28.23 24.79
2015 4th quarter 25.88 21.09 27.29 23.66
3rd quarter 25.71 20.79 28.23 23.19
2nd quarter 27.65 22.82 30.08 25.46
1st quarter 27.40 23.16 30.31 27.54
2014 4th quarter 24.68 20.98 31.02 26.36
3rd quarter 25.27 22.11 32.39 29.80
2nd quarter 25.86 22.22 35.95 30.35
1st quarter 28.10 23.88 38.36 33.13
2013 4th quarter 26.78 23.17 36.97 31.36
3rd quarter 25.32 20.89 33.60 27.28
2nd quarter 23.48 20.36 30.65 26.75
1st quarter 23.67 20.26 31.72 26.60
2012 4th quarter 20.33 18.27 26.81 23.52
3rd quarter 19.49 15.51 24.89 19.11
2nd quarter 15.57 13.76 20.26 17.32
1st quarter 16.56 14.48 21.51 18.34
2011 25.34 12.23 33.81 16.87