Philips 2015 Annual Report Download - page 161
Download and view the complete annual report
Please find page 161 of the 2015 Philips annual report below. You can navigate through the pages in the report by either clicking on the pages listed below, or by using the keyword search tool below to find specific information within the annual report.-
 1
1 -
2
-
3
-
4
-
5
-
6
-
7
-
8
-
9
-
10
-
11
-
12
-
13
-
14
-
15
-
16
-
17
-
18
-
19
-
20
-
21
-
22
-
23
-
24
-
25
-
26
-
27
-
28
-
29
-
30
-
31
-
32
-
33
-
34
-
35
-
36
-
37
-
38
-
39
-
40
-
41
-
42
-
43
-
44
-
45
-
46
-
47
-
48
-
49
-
50
-
51
-
52
-
53
-
54
-
55
-
56
-
57
-
58
-
59
-
60
-
61
-
62
-
63
-
64
-
65
-
66
-
67
-
68
-
69
-
70
-
71
-
72
-
73
-
74
-
75
-
76
-
77
-
78
-
79
-
80
-
81
-
82
-
83
-
84
-
85
-
86
-
87
-
88
-
89
-
90
-
91
-
92
-
93
-
94
-
95
-
96
-
97
-
98
-
99
-
100
-
101
-
102
-
103
-
104
-
105
-
106
-
107
-
108
-
109
-
110
-
111
-
112
-
113
-
114
-
115
-
116
-
117
-
118
-
119
-
120
-
121
-
122
-
123
-
124
-
125
-
126
-
127
-
128
-
129
-
130
-
131
-
132
-
133
-
134
-
135
-
136
-
137
-
138
-
139
-
140
-
141
-
142
-
143
-
144
-
145
-
146
-
147
-
148
-
149
-
150
-
 151
151 -
 152
152 -
 153
153 -
 154
154 -
 155
155 -
 156
156 -
 157
157 -
 158
158 -
 159
159 -
 160
160 -
 161
161 -
 162
162 -
 163
163 -
 164
164 -
 165
165 -
 166
166 -
 167
167 -
 168
168 -
 169
169 -
 170
170 -
 171
171 -
172
-
173
-
174
-
175
-
176
-
177
-
178
-
179
-
180
-
181
-
182
-
183
-
184
-
185
-
186
-
187
-
188
-
189
-
190
-
191
-
192
-
193
-
194
-
195
-
196
-
197
-
198
-
199
-
200
-
201
-
202
-
203
-
204
-
205
-
206
-
207
-
208
-
209
-
210
-
211
-
212
-
213
-
214
-
215
-
216
-
217
-
218
-
219
-
220
-
221
-
222
-
223
-
224
-
225
-
226
-
227
-
228
-
229
-
230
-
231
-
232
-
233
-
234
-
235
-
236
-
237
-
238
 |
 |
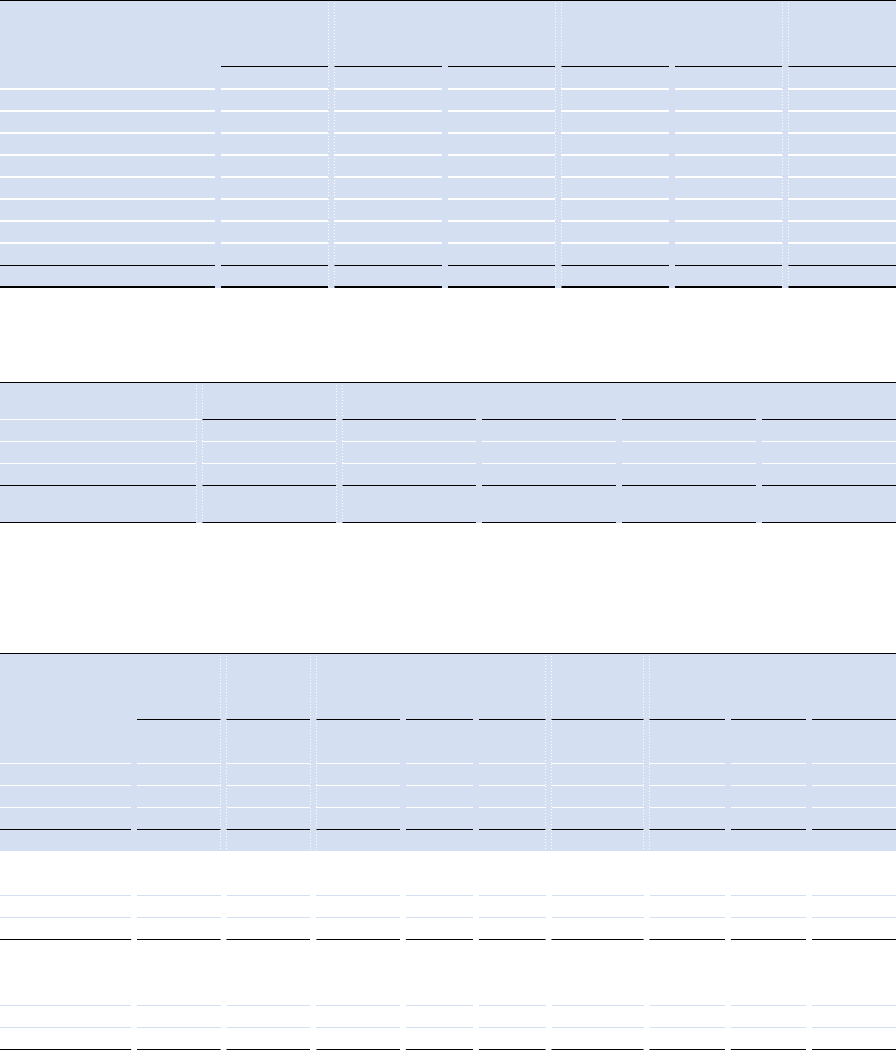
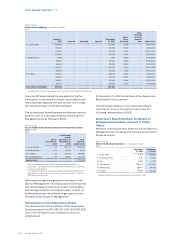
Group nancial statements 12.9
Annual Report 2015 161
For further information on remuneration costs, see sub-
section 10.2.4, Remuneration costs, of this Annual
Report.
The tables below give an overview of the performance
share plans, restricted share rights and the stock option
plans of the Company, held by the members of the
Board of Management:
Philips Group
Number of performance shares (holdings) in number of shares
2015
January 1,
2015
awarded
2015
awarded
dividend
shares
2015
realized
2015
December 31,
2015 vesting date
F.A. van Houten 66,903 − 2,194 − 69,097 05.03.2016
61,113 − 2,004 − 63,117 04.28.2017
− 54,877 1,800 − 56,677 05.05.2018
A. Bhattacharya 12,670 − 416 − 13,086 05.03.2016
11,071 − 363 − 11,434 04.28.2017
− 11,676 383 − 12,059 05.05.2018
P.A.J. Nota 31,678 − 1,039 − 32,717 05.03.2016
28,785 − 944 − 29,729 04.28.2017
− 26,465 868 − 27,333 05.05.2018
Performance shares (holdings)212,220 93,018 10,011 − 315,249
Philips Group
Number of restricted share rights (holdings) in number of shares
2015
January 1, 2015 awarded 2015 released 2015 December 31, 2015
potential
premium shares
F.A. van Houten 6,667 − 6,667 − 7,010
A. Bhattacharya1) 1,467 − 1,467 − 1,374
P.A.J. Nota 4,534 − 4,534 − 4,291
Restricted share rights
(holdings)
12,668 − 12,668 − 12,675
1) Awarded before date of appointment as a member of the Board of Management
Philips Group
Remuneration costs of individual members of the Board of Management in EUR
2013 - 2015
Base
compen-
sation/
salary
annual
incentive1)
perfor
mance
shares2)
stock
options2)
restric-
ted share
rights2)
pension
allowances
pension
scheme
costs
other
compen-
sation3)
total
costs
2015
F.A. van Houten 1,168,750 768,920 1,273,940 17,713 28,279 529,387 25,241 78,035 3,890,265
A. Bhattacharya 23,551 11,937 8,968 − 183 7,315 886 998 53,838
R.H. Wirahadiraksa 664,583 239,250 (652,049) 12,045 (37,210) 290,772 24,002 29,477 570,870
P.A.J. Nota 672,500 383,112 605,749 12,045 21,964 270,529 26,302 104,918 2,097,119
2,529,384 1,403,219 1,236,608 41,803 13,216 1,098,003 76,431 213,428 6,612,092
2014
F.A. van Houten 1,137,500 349,600 860,564 101,344 76,951 − 485,655 86,554 3,098,168
R.H. Wirahadiraksa 712,500 156,600 446,337 68,914 52,965 − 298,995 35,909 1,772,220
P.A.J. Nota 643,750 258,180 406,358 68,914 57,200 − 267,037 63,507 1,764,946
2,493,750 764,380 1,713,259 239,172 187,116 − 1,051,687 185,970 6,635,334
20134)
F.A. van Houten 1,100,000 1,081,520 1,594,675 461,215 190,441 − 468,407 75,906 4,972,164
R.H. Wirahadiraksa 656,250 497,745 1,040,393 307,699 128,856 − 263,451 35,732 2,930,126
P.A.J. Nota 618,750 561,713 1,025,153 352,608 146,626 − 253,605 68,206 3,026,661
2,375,000 2,140,978 3,660,221 1,121,522 465,923 − 985,463 179,844 10,928,951
1) The annual incentives are related to the performance in the year reported which are paid out in the subsequent year. For more details on the annual incentives,
see sub-section 10.2.6, Annual Incentive, of this Annual Report
2) Costs of performance shares, stock options and restricted share rights (including the once-only Accelerate! Grant) are based on accounting standards (IFRS) and
do not reect the value of stock options at the end of the lock up period and the value of performance shares and restricted share rights at the vesting/release
date
3) The stated amounts mainly concern (share of) allowances to members of the Board of Management that can be considered as remuneration. In a situation
where such a share of an allowance can be considered as (indirect) remuneration (for example, private use of the company car), then the share is both valued
and accounted for here. The method employed by the scal authorities in the Netherlands is the starting point for the value stated
4) A crisis levy of 16% has been imposed by the Dutch government amounting to in total EUR 681,596 for 2013. This crisis tax levy was payable by the employer and
was charged over income of employees exceeding a EUR 150,000 threshold in 2013. These expenses do not form part of the remuneration costs mentioned