Philips 2015 Annual Report Download - page 223
Download and view the complete annual report
Please find page 223 of the 2015 Philips annual report below. You can navigate through the pages in the report by either clicking on the pages listed below, or by using the keyword search tool below to find specific information within the annual report.-
 1
1 -
2
-
3
-
4
-
5
-
6
-
7
-
8
-
9
-
10
-
11
-
12
-
13
-
14
-
15
-
16
-
17
-
18
-
19
-
20
-
21
-
22
-
23
-
24
-
25
-
26
-
27
-
28
-
29
-
30
-
31
-
32
-
33
-
34
-
35
-
36
-
37
-
38
-
39
-
40
-
41
-
42
-
43
-
44
-
45
-
46
-
47
-
48
-
49
-
50
-
51
-
52
-
53
-
54
-
55
-
56
-
57
-
58
-
59
-
60
-
61
-
62
-
63
-
64
-
65
-
66
-
67
-
68
-
69
-
70
-
71
-
72
-
73
-
74
-
75
-
76
-
77
-
78
-
79
-
80
-
81
-
82
-
83
-
84
-
85
-
86
-
87
-
88
-
89
-
90
-
91
-
92
-
93
-
94
-
95
-
96
-
97
-
98
-
99
-
100
-
101
-
102
-
103
-
104
-
105
-
106
-
107
-
108
-
109
-
110
-
111
-
112
-
113
-
114
-
115
-
116
-
117
-
118
-
119
-
120
-
121
-
122
-
123
-
124
-
125
-
126
-
127
-
128
-
129
-
130
-
131
-
132
-
133
-
134
-
135
-
136
-
137
-
138
-
139
-
140
-
141
-
142
-
143
-
144
-
145
-
146
-
147
-
148
-
149
-
150
-
151
-
152
-
153
-
154
-
155
-
156
-
157
-
158
-
159
-
160
-
161
-
162
-
163
-
164
-
165
-
166
-
167
-
168
-
169
-
170
-
171
-
172
-
173
-
174
-
175
-
176
-
177
-
178
-
179
-
180
-
181
-
182
-
183
-
184
-
185
-
186
-
187
-
188
-
189
-
190
-
191
-
192
-
193
-
194
-
195
-
196
-
197
-
198
-
199
-
200
-
201
-
202
-
203
-
204
-
205
-
206
-
207
-
208
-
209
-
210
-
211
-
212
-
 213
213 -
 214
214 -
 215
215 -
 216
216 -
 217
217 -
 218
218 -
 219
219 -
 220
220 -
 221
221 -
 222
222 -
 223
223 -
 224
224 -
 225
225 -
 226
226 -
 227
227 -
 228
228 -
 229
229 -
 230
230 -
 231
231 -
 232
232 -
 233
233 -
234
-
235
-
236
-
237
-
238
 |
 |

Five-year overview 16
Annual Report 2015 223
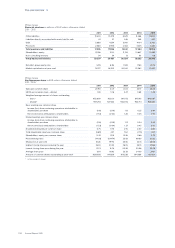
16 Five-year overview
Philips Group
General data in millions of EUR unless otherwise stated
2011 - 2015
2011 2012 2013 2014 2015
Sales 19,918 22,234 21,990 21,391 24,244
% increase over previous year 3% 12% (1)% (3)% 13%
Income from operations (EBIT) (loss) (542) 592 1,855 486 992
Financial income and expenses - net (331) (329) (330) (301) (369)
Income (loss) from continuing operations (1,106) (166) 1,034 221 414
Income (loss) from continuing operations attributable to shareholders (1,110) (171) 1,031 225 400
Income (loss) from discontinued operations (350) 136 138 190 245
Net income (loss) (1,456) (30) 1,172 411 659
Net income (loss) attributable to shareholders (1,460) (35) 1,169 415 645
Free cash ow (53) 1,645 82 497 325
Net assets 12,362 11,185 11,227 10,968 11,780
Turnover rate of net operating capital1) 1.81 2.22 2.39 2.30 2.32
Total employees at year-end 125,240 118,087 116,082 113,678 112,959
1) Calculated based upon the values excluding the businesses restated to discontinued operations.
Philips Group
Income in millions of EUR unless otherwise stated
2011 - 2015
2011 2012 2013 2014 2015
EBIT (542) 592 1,855 486 992
as a % of sales (2.7)% 2.7% 8.4% 2.3% 4.1%
EBITA 1,334 1,003 2,276 821 1,372
as a % of sales 6.7% 4.5% 10.4% 3.8% 5.7%
Income taxes (248) (218) (466) (26) (239)
as a % of income before taxes 28.4% (82.9)% (30.6)% (14.1)% (38.4)%
Income (loss) from continuing operations (1,106) (166) 1,034 221 414
as a % of shareholders’ equity (ROE) (8.2)% (1.4)% 9.4% 2.0% 3.6%
Net income (loss) (1,456) (30) 1,172 411 659
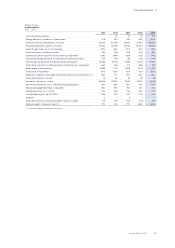
Philips Group
Capital employed in millions of EUR unless otherwise stated
2011 - 2015
2011 2012 2013 2014 2015
Cash and cash equivalents 3,147 3,834 2,465 1,873 1,766
Receivables and other current assets 5,567 5,128 5,220 5,591 5,655
Assets classied as held for sale 551 43 507 1,613 1,809
Inventories 3,625 3,495 3,240 3,314 3,463
Non-current nancial assets/investments in associates 549 726 657 619 670
Non-current receivables/assets 1,932 2,217 1,924 2,721 3,075
Property, plant and equipment 3,014 2,959 2,780 2,095 2,322
Intangible assets 11,012 10,679 9,766 10,526 12,216
Total assets 29,397 29,081 26,559 28,352 30,976
Property, plant and equipment:
Capital expenditures for the year 477 479 482 437 522
Depreciation for the year 525 588 521 592 582
Capital expenditures: depreciation 0.9 0.8 0.9 0.7 0.9
Inventories as a % of sales1) 16.5% 14.1% 13.7% 15.3% 14.2%
Outstanding trade receivables, in days sales1) 54 50 53 56 56
1) Calculated based upon the values excluding inventories and sales related to acquisitions, divestments and discontinued operations