Philips 2015 Annual Report Download - page 37
Download and view the complete annual report
Please find page 37 of the 2015 Philips annual report below. You can navigate through the pages in the report by either clicking on the pages listed below, or by using the keyword search tool below to find specific information within the annual report.-
 1
1 -
2
-
3
-
4
-
5
-
6
-
7
-
8
-
9
-
10
-
11
-
12
-
13
-
14
-
15
-
16
-
17
-
18
-
19
-
20
-
21
-
22
-
23
-
24
-
25
-
26
-
 27
27 -
 28
28 -
 29
29 -
 30
30 -
 31
31 -
 32
32 -
 33
33 -
 34
34 -
 35
35 -
 36
36 -
 37
37 -
 38
38 -
 39
39 -
 40
40 -
 41
41 -
 42
42 -
 43
43 -
 44
44 -
 45
45 -
 46
46 -
 47
47 -
48
-
49
-
50
-
51
-
52
-
53
-
54
-
55
-
56
-
57
-
58
-
59
-
60
-
61
-
62
-
63
-
64
-
65
-
66
-
67
-
68
-
69
-
70
-
71
-
72
-
73
-
74
-
75
-
76
-
77
-
78
-
79
-
80
-
81
-
82
-
83
-
84
-
85
-
86
-
87
-
88
-
89
-
90
-
91
-
92
-
93
-
94
-
95
-
96
-
97
-
98
-
99
-
100
-
101
-
102
-
103
-
104
-
105
-
106
-
107
-
108
-
109
-
110
-
111
-
112
-
113
-
114
-
115
-
116
-
117
-
118
-
119
-
120
-
121
-
122
-
123
-
124
-
125
-
126
-
127
-
128
-
129
-
130
-
131
-
132
-
133
-
134
-
135
-
136
-
137
-
138
-
139
-
140
-
141
-
142
-
143
-
144
-
145
-
146
-
147
-
148
-
149
-
150
-
151
-
152
-
153
-
154
-
155
-
156
-
157
-
158
-
159
-
160
-
161
-
162
-
163
-
164
-
165
-
166
-
167
-
168
-
169
-
170
-
171
-
172
-
173
-
174
-
175
-
176
-
177
-
178
-
179
-
180
-
181
-
182
-
183
-
184
-
185
-
186
-
187
-
188
-
189
-
190
-
191
-
192
-
193
-
194
-
195
-
196
-
197
-
198
-
199
-
200
-
201
-
202
-
203
-
204
-
205
-
206
-
207
-
208
-
209
-
210
-
211
-
212
-
213
-
214
-
215
-
216
-
217
-
218
-
219
-
220
-
221
-
222
-
223
-
224
-
225
-
226
-
227
-
228
-
229
-
230
-
231
-
232
-
233
-
234
-
235
-
236
-
237
-
238
 |
 |

Group performance 5.2.5
Annual Report 2015 37
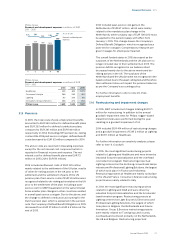
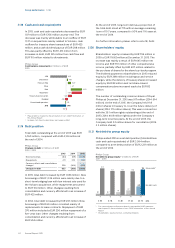
Compared to 2014, the number of employees in
continuing operations decreased by 1,161. The decrease
reects industrial footprint rationalization at Lighting
and a reduction in third-party workers at Consumer
Lifestyle, partly oset by the consolidation of the
Volcano acquisition at Healthcare.
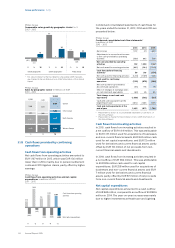
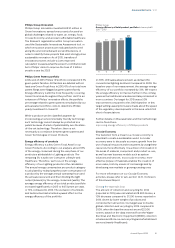
Approximately 54% of the Philips workforce was
located in mature geographies, and about 46% in
growth geographies. In 2015, the number of employees
in mature geographies increased by 1,081, mainly due
to the Volcano acquisition at Healthcare. The number
of employees in growth geographies decreased by
2,242 largely driven by footprint rationalization at
Lighting.
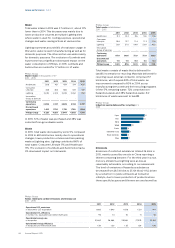
Philips Group
Employees per geographic cluster in FTEs at year-end
2013 - 2015
2013 2014 2015
Western Europe 28,944 29,105 28,590
North America 24,401 22,283 23,614
Other mature geographies 3,419 3,643 3,908
Mature geographies 56,764 55,031 56,112
Growth geographies 48,873 50,334 48,092
Continuing operations 105,637 105,365 104,204
Discontinued operations 10,445 8,313 8,755
Philips Group 116,082 113,678 112,959
Philips Group
Employment in FTEs at year-end
2013 - 2015
2013 2014 2015
Balance as of January 1 118,087 116,082 113,678
Consolidation changes:
Acquisitions - 1,506 1,865
Divestments (705) (247) (300)
Changes in discontinued
operations (186) (2,132) 442
Other changes (1,114) (1,531) (2,726)
Balance as of December 31 116,082 113,678 112,959
In 2016, the number of employees is expected to be
below the levels of 2015.
In 2015, employee turnover amounted to 16.6% (of
which 9.7% was voluntary) compared to 14.9% (6.4%
voluntary) in 2014. 2015 turnover was mainly due to the
changing industrial footprint and our overhead
reduction program.
Philips Group
Employee turnover in %
2015
Sta
Profes-
sionals
Manage-
ment
Execu-
tives Total
Female 20.0 12.4 11.3 13.9 16.6
Male 24.0 11.3 10.2 15.2 16.6
Philips Group 22.3 11.6 10.4 14.9 16.6
Philips Group
Voluntary turnover in %
2015
Sta
Profes-
sionals
Manage-
ment
Execu-
tives Total
Female 11.4 7.7 5.8 8.3 9.7
Male 13.9 6.8 5.1 5.9 9.7
Philips Group 12.9 7.1 5.3 6.4 9.7
5.2.5 Developing our people
Philips University was launched in Q4 2014, and our
focus on leader-led learning and building a learning
organization as part of our growth and performance
culture continued in 2015. We believe that continuous
learning maximizes the potential of all employees –
and consequently Philips’ potential to deliver for
customers and consumers. Philips University embraces
a philosophy of learning that balances learning carried
out on the job, coaching and mentoring, and formal
learning methods such as classroom teaching and e-
learnings. Presently, we are exploring new learning
channels to improve capability building and focus on
business-critical topics and key roles that will increase
the impact of the University.
More than one million hours in total were spent on
training through Philips University in 2015.
Training spend
Our external training spend in 2015 amounted to EUR
50.4 million, up from EUR 44.7 million in 2014. This
reects an increase in the number of courses oered
through the Philips University, supporting the
transformation process at Philips, as well as a strong
increase in courses attended.
For more information on our people’s development,
please refer to sub-section 14.2.2, People development,
of this Annual Report.
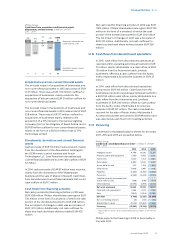
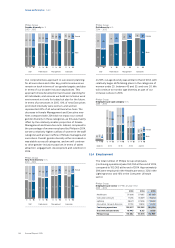
5.2.6 Health and Safety
Philips strives for an injury-free and illness-free work
environment, with a sharp focus on reducing the
number of injuries and improving processes. The Lost
Workday Injury Cases (LWIC) rate is dened as a KPI, on
which we set yearly targets for the company, our
individual sectors and Business Groups.
In 2015, we recorded 213 LWIC, i.e. occupational injury
cases where the injured person is unable to work one
or more days after the injury. This represents a
signicant decrease compared with 227 in 2014, and
continues the downward trend since 2010. The LWIC
rate decreased to 0.21 per 100 FTEs, compared with
0.23 in 2014. The number of Lost Workdays caused by
injuries decreased by 1,087 days (some 12%) to 7,981
days in 2015.
For more information on Health and Safety, please refer
to sub-section 14.2.4, Health and Safety performance,
of this Annual Report.