Philips 2015 Annual Report Download - page 128
Download and view the complete annual report
Please find page 128 of the 2015 Philips annual report below. You can navigate through the pages in the report by either clicking on the pages listed below, or by using the keyword search tool below to find specific information within the annual report.-
 1
1 -
2
-
3
-
4
-
5
-
6
-
7
-
8
-
9
-
10
-
11
-
12
-
13
-
14
-
15
-
16
-
17
-
18
-
19
-
20
-
21
-
22
-
23
-
24
-
25
-
26
-
27
-
28
-
29
-
30
-
31
-
32
-
33
-
34
-
35
-
36
-
37
-
38
-
39
-
40
-
41
-
42
-
43
-
44
-
45
-
46
-
47
-
48
-
49
-
50
-
51
-
52
-
53
-
54
-
55
-
56
-
57
-
58
-
59
-
60
-
61
-
62
-
63
-
64
-
65
-
66
-
67
-
68
-
69
-
70
-
71
-
72
-
73
-
74
-
75
-
76
-
77
-
78
-
79
-
80
-
81
-
82
-
83
-
84
-
85
-
86
-
87
-
88
-
89
-
90
-
91
-
92
-
93
-
94
-
95
-
96
-
97
-
98
-
99
-
100
-
101
-
102
-
103
-
104
-
105
-
106
-
107
-
108
-
109
-
110
-
111
-
112
-
113
-
114
-
115
-
116
-
117
-
 118
118 -
 119
119 -
 120
120 -
 121
121 -
 122
122 -
 123
123 -
 124
124 -
 125
125 -
 126
126 -
 127
127 -
 128
128 -
 129
129 -
 130
130 -
 131
131 -
 132
132 -
 133
133 -
 134
134 -
 135
135 -
 136
136 -
 137
137 -
 138
138 -
139
-
140
-
141
-
142
-
143
-
144
-
145
-
146
-
147
-
148
-
149
-
150
-
151
-
152
-
153
-
154
-
155
-
156
-
157
-
158
-
159
-
160
-
161
-
162
-
163
-
164
-
165
-
166
-
167
-
168
-
169
-
170
-
171
-
172
-
173
-
174
-
175
-
176
-
177
-
178
-
179
-
180
-
181
-
182
-
183
-
184
-
185
-
186
-
187
-
188
-
189
-
190
-
191
-
192
-
193
-
194
-
195
-
196
-
197
-
198
-
199
-
200
-
201
-
202
-
203
-
204
-
205
-
206
-
207
-
208
-
209
-
210
-
211
-
212
-
213
-
214
-
215
-
216
-
217
-
218
-
219
-
220
-
221
-
222
-
223
-
224
-
225
-
226
-
227
-
228
-
229
-
230
-
231
-
232
-
233
-
234
-
235
-
236
-
237
-
238
 |
 |

Group nancial statements 12.9 6
128 Annual Report 2015
Philips Group
Interests in materially wholly owned subsidiaries
in alphabetical order
2015
Legal entity name
Principal country
of business
Invivo Corporation United States
Lumileds Malaysia Sdn. Bhd. Malaysia
Philips (China) Investment Company, Ltd. China
Philips Consumer Lifestyle B.V. Netherlands
Philips Electronics North America Corporation United States
Philips Electronics Singapore Pte Ltd Singapore
Philips GmbH Germany
Philips Innovative Applications Belgium
Philips Lighting B.V. Netherlands
Philips Medizin Systeme Böblingen GmbH Germany
Philips Nederland B.V. Netherlands
Philips Oral Healthcare, LLC United States
Philips Respironics GK Japan
Philips Ultrasound, Inc. United States
RI Finance, Inc. United States
RIC Investments, LLC United States
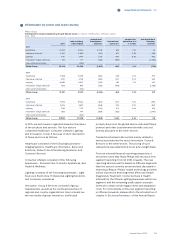
Not wholly owned subsidiaries
In total, 19 consolidated subsidiaries are not wholly
owned by the Company. Among the consolidated legal
entities is Saudi Lighting Company Limited created after
the acquisition of General Lighting Company (GLC)
where the Company owns 51% of the voting power. The
Company controls this entity. The sales, income from
operations and net income of this entity is 3% of the
consolidated nancial data. The non-controlling
interest of 49% represents an amount of EUR 102
million as per December 31, 2015.
Also among the consolidated legal entities is Philips
India Limited where the Company owns 96% of the
voting power. The non-controlling interest of 4%
represents an amount of EUR 10 million as per
December 31, 2015.
The sales, income from operations and net income of
the remaining not wholly owned subsidiaries (before
any intra-group eliminations) are less than 2% of the
consolidated nancial data of the Company and are
therefore not considered material.
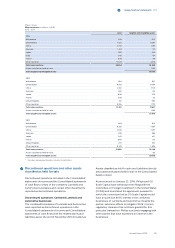
Investments in associates
Philips has investments in a number of associates, none
of them are regarded as individually material.
The changes during 2015 are as follows:
Philips Group
Investments in associates in millions of EUR
2015
Total investments
Balance as of January 1, 2015 157
Changes:
Acquisitions/additions 1
Reclassications 18
Share in income 10
Share in other comprehensive income 1
Impairments (2)
Dividends declared (17)
Translation and exchange rate dierences 13
Balance as of December 31, 2015 181
Included in the line reclassications is an investment of
EUR 18 million that was reclassied from available-for-
sale nancial assets. The Company owns less than 20%
in the capital of the underlying company but is able to
exercise signicant inuence and is therefore
accounted for as an Investment in associate.
The Company owns one equity interest which
represents more than 20% in the capital of the
underlying company. With respect to this equity
interest, the Company cannot exercise signicant
inuence based on governance agreements concluded
among shareholders. This equity interests is accounted
for as Other non-current nancial assets. In 2015, the
Company’s share in the net income of this entity was
insignicant.
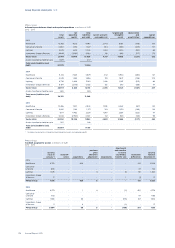
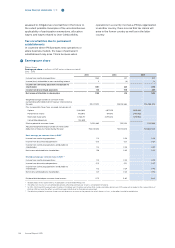
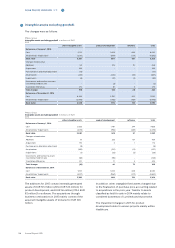
6Income from operations
For information related to Sales and tangible and
intangible assets on a geographical and sector basis,
see note 2, Information by sector and main country.
Philips Group
Sales and costs by nature in millions of EUR
2013 - 2015
2013 2014 2015
Sales 21,990 21,391 24,244
Costs of materials used (7,494) (7,296) (8,446)
Employee benet expenses (5,814) (6,080) (7,107)
Depreciation and amortization (1,177) (1,187) (1,281)
Shipping and handling (762) (741) (806)
Advertising and promotion (869) (913) (1,000)
Lease expense 1) (344) (318) (324)
Other operational costs 2) (3,734) (4,156) (4,375)
Impairment of goodwill (28) (3) -
Other business income (expenses) 87 (211) 87
Income from operations 1,855 486 992
1) Lease expense includes EUR 35 million (2014: EUR 35 million, 2013: EUR
42 million) of other costs, such as fuel and electricity, and taxes to be
paid and reimbursed to the lessor
2) Other operational costs contain items which are dissimilar in nature and
individually insignicant in amount to disclose separately. These costs
contain among others expenses for outsourcing services, mainly in IT
and HR, 3rd party workers, consultants, warranty, patents and costs for
travelling and external legal services.