Philips 2015 Annual Report Download - page 26
Download and view the complete annual report
Please find page 26 of the 2015 Philips annual report below. You can navigate through the pages in the report by either clicking on the pages listed below, or by using the keyword search tool below to find specific information within the annual report.-
 1
1 -
2
-
3
-
4
-
5
-
6
-
7
-
8
-
9
-
10
-
11
-
12
-
13
-
14
-
15
-
 16
16 -
 17
17 -
 18
18 -
 19
19 -
 20
20 -
 21
21 -
 22
22 -
 23
23 -
 24
24 -
 25
25 -
 26
26 -
 27
27 -
 28
28 -
 29
29 -
 30
30 -
 31
31 -
 32
32 -
 33
33 -
 34
34 -
 35
35 -
 36
36 -
37
-
38
-
39
-
40
-
41
-
42
-
43
-
44
-
45
-
46
-
47
-
48
-
49
-
50
-
51
-
52
-
53
-
54
-
55
-
56
-
57
-
58
-
59
-
60
-
61
-
62
-
63
-
64
-
65
-
66
-
67
-
68
-
69
-
70
-
71
-
72
-
73
-
74
-
75
-
76
-
77
-
78
-
79
-
80
-
81
-
82
-
83
-
84
-
85
-
86
-
87
-
88
-
89
-
90
-
91
-
92
-
93
-
94
-
95
-
96
-
97
-
98
-
99
-
100
-
101
-
102
-
103
-
104
-
105
-
106
-
107
-
108
-
109
-
110
-
111
-
112
-
113
-
114
-
115
-
116
-
117
-
118
-
119
-
120
-
121
-
122
-
123
-
124
-
125
-
126
-
127
-
128
-
129
-
130
-
131
-
132
-
133
-
134
-
135
-
136
-
137
-
138
-
139
-
140
-
141
-
142
-
143
-
144
-
145
-
146
-
147
-
148
-
149
-
150
-
151
-
152
-
153
-
154
-
155
-
156
-
157
-
158
-
159
-
160
-
161
-
162
-
163
-
164
-
165
-
166
-
167
-
168
-
169
-
170
-
171
-
172
-
173
-
174
-
175
-
176
-
177
-
178
-
179
-
180
-
181
-
182
-
183
-
184
-
185
-
186
-
187
-
188
-
189
-
190
-
191
-
192
-
193
-
194
-
195
-
196
-
197
-
198
-
199
-
200
-
201
-
202
-
203
-
204
-
205
-
206
-
207
-
208
-
209
-
210
-
211
-
212
-
213
-
214
-
215
-
216
-
217
-
218
-
219
-
220
-
221
-
222
-
223
-
224
-
225
-
226
-
227
-
228
-
229
-
230
-
231
-
232
-
233
-
234
-
235
-
236
-
237
-
238
 |
 |
Group performance 5.1.3
26 Annual Report 2015
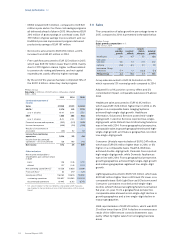
Healthcare
EBITA amounted to EUR 1,024 million, or 9.4% of sales,
compared to EUR 616 million, or 6.7% of sales, in 2014.
EBITA in 2015 included restructuring and acquisition-
related charges of EUR 168 million, which included the
Volcano acquisition, compared to EUR 70 million in
2014. 2015 EBITA also included charges of EUR 28
million related to the currency revaluation of the
provision for the Masimo litigation, EUR 8 million
related to the devaluation of the Argentine peso, and a
EUR 31 million legal provision. EBITA in 2014 included
charges of EUR 366 million related to the provision for
the Masimo litigation, charges of EUR 49 million of
mainly inventory write-downs related to Cleveland,
and a EUR 16 million past-service pension cost gain.
Excluding these items, the increase was largely driven
by higher volumes, partly oset by an increase in
Quality & Regulatory spend and higher planned
expenditure for growth initiatives.
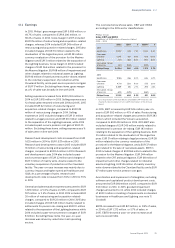
Consumer Lifestyle
EBITA amounted to EUR 673 million, or 12.6% of sales,
a year-on-year increase of EUR 100 million. 2015 EBITA
included restructuring and acquisition-related charges
of EUR 36 million and charges related to the
devaluation of the Argentine peso of EUR 13 million.
2014 EBITA included restructuring and acquisition-
related charges of EUR 9 million and a EUR 11 million
past-service pension cost gain. The year-on-year
increase was largely driven by cost productivity, higher
volumes, and product mix, partly oset by higher
restructuring and acquisition-related charges.
Lighting
EBITA amounted to EUR 594 million, or 8.0% of sales, a
year-on-year increase of EUR 301 million. 2015 EBITA
included EUR 99 million of restructuring and
acquisition-related charges and EUR 14 million of
charges related to the devaluation of the Argentine
peso. 2014 EBITA included EUR 245 million of
restructuring and acquisition-related charges, EUR 68
million of impairment and other charges related to
industrial assets, and a EUR 13 million past-service
pension cost gain. The increase in EBITA was largely
driven by cost productivity, improved LED margins and
lower restructuring and acquisition-related charges.
Innovation, Group & Services
EBITA amounted to a net cost of EUR 919 million,
compared to EUR 661 million in 2014. EBITA in 2015
included a EUR 20 million net release of restructuring
charges, compared to EUR 113 million restructuring
charges in 2014. EBITA in 2015 also included charges of
EUR 183 million related to the separation of the Lighting
business, EUR 345 million mainly related to settlements
for pension de-risking, and a EUR 37 million gain related
to the sale of real estate assets. EBITA in Q4 2014 also
included EUR 244 million of charges related to the CRT
antitrust litigation and a EUR 27 million past-service
pension cost gain. Excluding these items, the decrease
in EBITA was largely driven by higher Group and
Regional Costs, mainly related to information security
and Quality & Regulatory spend, investments in
emerging business areas, and lower licensing revenue
in IP Royalties.
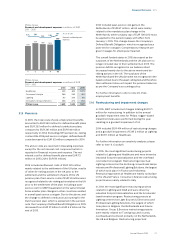
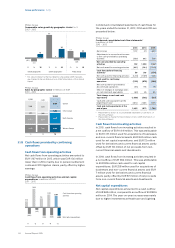
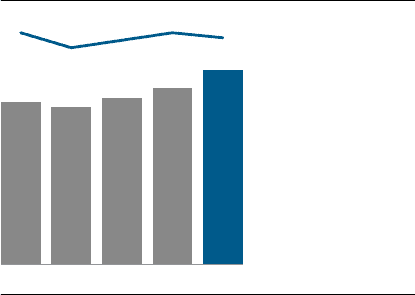
5.1.3 Advertising and promotion
Philips’ total advertising and promotion expenses were
EUR 1,000 million in 2015, an increase of 10% compared
to 2014. The increase was mainly due to investments in
key growth geographies, such as China and India, and
mature geographies such as the United States and
Japan. The total advertising and promotion investment
as a percentage of sales was 4.1% in 2015, compared to
4.3% in 2014.
Philips brand value increased by 6% to over USD 10.9
billion as measured by Interbrand. In the 2015 listing,
Philips is ranked the 47th most valuable brand in the
world.
Philips Group
Advertising and promotion expenses in millions of EUR
2011 - 2015
852
‘11
829
‘12
869
‘13
913
‘14
1,000 Advertising and promotion
expenses
‘15
4.3%
3.7% 4.0% 4.3% 4.1% As a % of sales
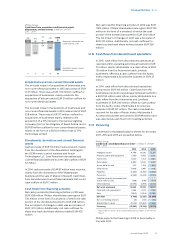
5.1.4 Research and development
Research and development costs increased from EUR
1,635 million in 2014 to EUR 1,927 million in 2015. 2015
included EUR 16 million of restructuring and
acquisition-related charges, compared to EUR 34
million in 2014. 2014 also included a past-service
pension gain of EUR 22 million and charges of EUR 3
million of mainly inventory write-downs related to
Cleveland. The year-on-year increase was mainly due
to currency impact and higher spend at Healthcare and
IG&S. As a percentage of sales, research and
development costs increased from 7.6% in 2014 to 7.9%.