Philips 2012 Annual Report Download - page 12
Download and view the complete annual report
Please find page 12 of the 2012 Philips annual report below. You can navigate through the pages in the report by either clicking on the pages listed below, or by using the keyword search tool below to find specific information within the annual report.-
 1
1 -
 2
2 -
 3
3 -
 4
4 -
 5
5 -
 6
6 -
 7
7 -
 8
8 -
 9
9 -
 10
10 -
 11
11 -
 12
12 -
 13
13 -
 14
14 -
 15
15 -
 16
16 -
 17
17 -
 18
18 -
 19
19 -
 20
20 -
 21
21 -
 22
22 -
23
-
24
-
25
-
26
-
27
-
28
-
29
-
30
-
31
-
32
-
33
-
34
-
35
-
36
-
37
-
38
-
39
-
40
-
41
-
42
-
43
-
44
-
45
-
46
-
47
-
48
-
49
-
50
-
51
-
52
-
53
-
54
-
55
-
56
-
57
-
58
-
59
-
60
-
61
-
62
-
63
-
64
-
65
-
66
-
67
-
68
-
69
-
70
-
71
-
72
-
73
-
74
-
75
-
76
-
77
-
78
-
79
-
80
-
81
-
82
-
83
-
84
-
85
-
86
-
87
-
88
-
89
-
90
-
91
-
92
-
93
-
94
-
95
-
96
-
97
-
98
-
99
-
100
-
101
-
102
-
103
-
104
-
105
-
106
-
107
-
108
-
109
-
110
-
111
-
112
-
113
-
114
-
115
-
116
-
117
-
118
-
119
-
120
-
121
-
122
-
123
-
124
-
125
-
126
-
127
-
128
-
129
-
130
-
131
-
132
-
133
-
134
-
135
-
136
-
137
-
138
-
139
-
140
-
141
-
142
-
143
-
144
-
145
-
146
-
147
-
148
-
149
-
150
-
151
-
152
-
153
-
154
-
155
-
156
-
157
-
158
-
159
-
160
-
161
-
162
-
163
-
164
-
165
-
166
-
167
-
168
-
169
-
170
-
171
-
172
-
173
-
174
-
175
-
176
-
177
-
178
-
179
-
180
-
181
-
182
-
183
-
184
-
185
-
186
-
187
-
188
-
189
-
190
-
191
-
192
-
193
-
194
-
195
-
196
-
197
-
198
-
199
-
200
-
201
-
202
-
203
-
204
-
205
-
206
-
207
-
208
-
209
-
210
-
211
-
212
-
213
-
214
-
215
-
216
-
217
-
218
-
219
-
220
-
221
-
222
-
223
-
224
-
225
-
226
-
227
-
228
-
229
-
230
-
231
 |
 |

2 Group strategic focus 2 - 2
12 Annual Report 2012
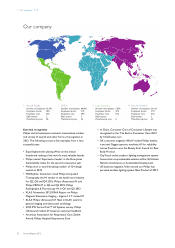
* Source: UN Department of Economic and Social Affairs
** Source: Philips
*** Source: IMF & CIA Factbook
1 Africa
Population 1,043 million*
Lives improved 38 million**
GDP $ 2,035 billion***
2 ASEAN & Pacific
Population 883 million*
Lives improved 223 million**
GDP $ 5,438 billion***
3 Benelux
Population 28 million*
Lives improved 28 million**
GDP $ 1,302 billion***
4 Central & East Europe
Population 125 million*
Lives improved 69 million**
GDP $ 1,393 billion***
5 DACH
Population 98 million*
Lives improved 87 million**
GDP $ 4,384 billion***
6 France
Population 68 million*
Lives improved 56 million**
GDP $ 2,590 billion***
7 Greater China
Population 1,384 million*
Lives improved 313 million**
GDP $ 9,017 billion***
8 Iberia
Population 57 million*
Lives improved 41 million**
GDP $ 1,554 billion***
9 Indian Subcontinent
Population 1,410 million*
Lives improved 152 million**
GDP $ 2,146 billion***
10 Italy, Israel & Greece
Population 81 million*
Lives improved 52 million**
GDP $ 2,515 billion***
11 Japan
Population 127 million*
Lives improved 21 million**
GDP $ 5,984 billion***
12 Latin America
Population 588 million*
Lives improved 124 million**
GDP $ 5,934 billion***
13 Middle East & Turkey
Population 320 million*
Lives improved 83 million**
GDP $ 2,684 billion***
14 Nordics
Population 26 million*
Lives improved 25 million**
GDP $ 1,592 billion***
15 North America
Population 350 million*
Lives improved 269 million**
GDP $ 17,423 billion***
16 Russia & Central Asia
Population 284 million*
Lives improved 77 million**
GDP $ 2,598 billion***
17 UK & Ireland
Population 68 million*
Lives improved 46 million**
GDP $ 2,638 billion***
Lives improved by Philips: 1.7 billion
11
6
10
8
9
12
15
16
2
54
3
1
13
17
14
7
The Philips Business System
Centered around our company mission, vision and guiding
statement, the Philips Business System links four elements
into a coherent system: Our overall Group Strategy and
the resulting portfolio choices and resource allocation.
Our five Capabilities, Assets and Positions, Philips' unique
strenghts: deep customer insight, technology innovation,
our brand, global footprint, and our people. To
collectively leverage these unique strengths, we
rigorously apply common operating principles across the
Group to achieve "Philips Excellence". This in turn
maximizes the value we can create, value that we can then
reinvest in our portfolio of businesses, leading to further
strengthening of our CAPs.