Philips 2012 Annual Report Download - page 164
Download and view the complete annual report
Please find page 164 of the 2012 Philips annual report below. You can navigate through the pages in the report by either clicking on the pages listed below, or by using the keyword search tool below to find specific information within the annual report.-
 1
1 -
2
-
3
-
4
-
5
-
6
-
7
-
8
-
9
-
10
-
11
-
12
-
13
-
14
-
15
-
16
-
17
-
18
-
19
-
20
-
21
-
22
-
23
-
24
-
25
-
26
-
27
-
28
-
29
-
30
-
31
-
32
-
33
-
34
-
35
-
36
-
37
-
38
-
39
-
40
-
41
-
42
-
43
-
44
-
45
-
46
-
47
-
48
-
49
-
50
-
51
-
52
-
53
-
54
-
55
-
56
-
57
-
58
-
59
-
60
-
61
-
62
-
63
-
64
-
65
-
66
-
67
-
68
-
69
-
70
-
71
-
72
-
73
-
74
-
75
-
76
-
77
-
78
-
79
-
80
-
81
-
82
-
83
-
84
-
85
-
86
-
87
-
88
-
89
-
90
-
91
-
92
-
93
-
94
-
95
-
96
-
97
-
98
-
99
-
100
-
101
-
102
-
103
-
104
-
105
-
106
-
107
-
108
-
109
-
110
-
111
-
112
-
113
-
114
-
115
-
116
-
117
-
118
-
119
-
120
-
121
-
122
-
123
-
124
-
125
-
126
-
127
-
128
-
129
-
130
-
131
-
132
-
133
-
134
-
135
-
136
-
137
-
138
-
139
-
140
-
141
-
142
-
143
-
144
-
145
-
146
-
147
-
148
-
149
-
150
-
151
-
152
-
153
-
 154
154 -
 155
155 -
 156
156 -
 157
157 -
 158
158 -
 159
159 -
 160
160 -
 161
161 -
 162
162 -
 163
163 -
 164
164 -
 165
165 -
 166
166 -
 167
167 -
 168
168 -
 169
169 -
 170
170 -
 171
171 -
 172
172 -
 173
173 -
 174
174 -
175
-
176
-
177
-
178
-
179
-
180
-
181
-
182
-
183
-
184
-
185
-
186
-
187
-
188
-
189
-
190
-
191
-
192
-
193
-
194
-
195
-
196
-
197
-
198
-
199
-
200
-
201
-
202
-
203
-
204
-
205
-
206
-
207
-
208
-
209
-
210
-
211
-
212
-
213
-
214
-
215
-
216
-
217
-
218
-
219
-
220
-
221
-
222
-
223
-
224
-
225
-
226
-
227
-
228
-
229
-
230
-
231
 |
 |

12 Group financial statements 12.11 - 12.11
164 Annual Report 2012
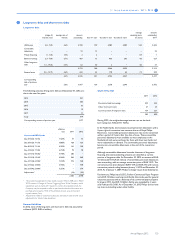
Pension expense of defined-benefit plans recognized in the Consolidated statements of income:
2010 2011 2012
Netherlands other total Netherlands other total Netherlands other total
Service cost 92 77 169 127 73 200 174 86 260
Interest cost on the
defined-benefit obligation 521 418 939 557 404 961 509 387 896
Expected return on plan assets (743) (344) (1,087) (713) (389) (1,102) (739) (429) (1,168)
Prior-service cost − (119) (119) − (20) (20) − 1 1
Settlement loss (gain) − (6) (6) − (1) (1) − 1 1
Curtailment loss (gain) − (1) (1) − (18) (18) (25) (6) (31)
Other 1 1 2 (1) 1 − − − −
Net periodic cost (income) (129) 26 (103) (30) 50 20 (81) 40 (41)
of which
discontinued operations 2 − 2 2 − 2 − (3) (3)
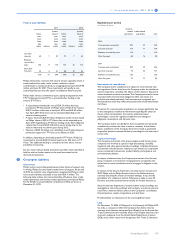
Amounts recognized in the Consolidated statements of comprehensive
income:
2010 2011 2012
Actuarial losses 1,535 1,517 250
Change in the effect of the cap on prepaids 427 (869) 299
Total recognised in other comprehensive
income 1,962 648 549
Total recognised in total comprehensive
income 1,859 668 508
Actual return on plan assets 1,807 1,740 2,556
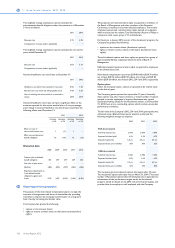
The pension expense of defined-benefit plans is recognized in the
following line items in the Consolidated statements of income:
2010 2011 2012
Cost of sales 6 8 (3)
Selling expenses 12 7 9
General and administrative expenses (120) 3 (41)
Research and development expenses (3) − (3)
(105) 18 (38)
The Company also sponsors defined-contribution and similar types of
plans for a significant number of salaried employees. The total cost of
these plans amounted to EUR 142 million (2011: EUR 120 million; 2010:
EUR 114 million). In 2012, the defined-contribution cost includes
contributions to multi-employer plans of EUR 8 million (2011: EUR 8
million; 2010: EUR 6 million).
Cash flows and costs in 2013
Philips expects considerable cash outflows in relation to employee
benefits which are estimated to amount to EUR 648 million in 2013,
consisting of EUR 432 million employer contributions to defined-
benefit pension plans, EUR 142 million employer contributions to
defined-contribution pension plans, EUR 58 million expected cash
outflows in relation to unfunded pension plans and EUR 16 million in
relation to unfunded retiree medical plans. The employer contributions
to defined-benefit pension plans are expected to amount to EUR 250
million for the Netherlands and EUR 182 million for other countries.
The Company plans to fund part of the existing deficit in the US pension
plan in 2013, which amount is included in the amounts aforementioned.
In accordance with revised IAS19 the service costs and interest expense
will be disclosed seperately for defined-benefit plans. The service cost
for 2013 is expected to amount to EUR 279 million, consisting of EUR
277 million for defined-benefit pension plans and EUR 2 million for
defined-benefit retiree medical plans. The net interest expense for 2013
is expected to amount to EUR 75 million, consisting of EUR 64 million
for defined-benefit pension plans and EUR 11 million for defined-
benefit retiree medical plans. The cost for defined-contribution pension
plans in 2013 is expected to amount EUR 142 million.
Assumptions
A significant demographic assumption used in the actuarial valuations
is the mortality table.
The mortality tables used for the Company’s major schemes are:
Netherlands: Prognosis table 2012-2062 including experience rating
TW2010.
United Kingdom retirees: SAPS 2002- Core CMI 2011 projection
United States: RP2000 CH Fully Generational
Germany: Richttafeln 2005 G.K. Heubeck
The Expected Return on Assets for any funded plan equals the average
of the expected returns per asset class weighted by their portfolio
weights in accordance with the fund’s strategic asset allocation. Where
liability-driven investment (LDI) strategies apply, the weights are in
accordance with the actual matching part and the strategic asset
allocation of the return portfolio.
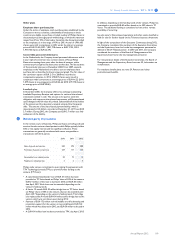
The weighted averages of the assumptions used to calculate the
defined-benefit obligations as of December 31 were as follows:
2011 2012
Netherlands other Netherlands other
Discount rate 3.9% 4.4% 3.3% 4.1%
Rate of
compensation
increase * 2.9% * 3.3%