Philips 2012 Annual Report Download - page 154
Download and view the complete annual report
Please find page 154 of the 2012 Philips annual report below. You can navigate through the pages in the report by either clicking on the pages listed below, or by using the keyword search tool below to find specific information within the annual report.-
 1
1 -
2
-
3
-
4
-
5
-
6
-
7
-
8
-
9
-
10
-
11
-
12
-
13
-
14
-
15
-
16
-
17
-
18
-
19
-
20
-
21
-
22
-
23
-
24
-
25
-
26
-
27
-
28
-
29
-
30
-
31
-
32
-
33
-
34
-
35
-
36
-
37
-
38
-
39
-
40
-
41
-
42
-
43
-
44
-
45
-
46
-
47
-
48
-
49
-
50
-
51
-
52
-
53
-
54
-
55
-
56
-
57
-
58
-
59
-
60
-
61
-
62
-
63
-
64
-
65
-
66
-
67
-
68
-
69
-
70
-
71
-
72
-
73
-
74
-
75
-
76
-
77
-
78
-
79
-
80
-
81
-
82
-
83
-
84
-
85
-
86
-
87
-
88
-
89
-
90
-
91
-
92
-
93
-
94
-
95
-
96
-
97
-
98
-
99
-
100
-
101
-
102
-
103
-
104
-
105
-
106
-
107
-
108
-
109
-
110
-
111
-
112
-
113
-
114
-
115
-
116
-
117
-
118
-
119
-
120
-
121
-
122
-
123
-
124
-
125
-
126
-
127
-
128
-
129
-
130
-
131
-
132
-
133
-
134
-
135
-
136
-
137
-
138
-
139
-
140
-
141
-
142
-
143
-
 144
144 -
 145
145 -
 146
146 -
 147
147 -
 148
148 -
 149
149 -
 150
150 -
 151
151 -
 152
152 -
 153
153 -
 154
154 -
 155
155 -
 156
156 -
 157
157 -
 158
158 -
 159
159 -
 160
160 -
 161
161 -
 162
162 -
 163
163 -
 164
164 -
165
-
166
-
167
-
168
-
169
-
170
-
171
-
172
-
173
-
174
-
175
-
176
-
177
-
178
-
179
-
180
-
181
-
182
-
183
-
184
-
185
-
186
-
187
-
188
-
189
-
190
-
191
-
192
-
193
-
194
-
195
-
196
-
197
-
198
-
199
-
200
-
201
-
202
-
203
-
204
-
205
-
206
-
207
-
208
-
209
-
210
-
211
-
212
-
213
-
214
-
215
-
216
-
217
-
218
-
219
-
220
-
221
-
222
-
223
-
224
-
225
-
226
-
227
-
228
-
229
-
230
-
231
 |
 |

12 Group financial statements 12.11 - 12.11
154 Annual Report 2012
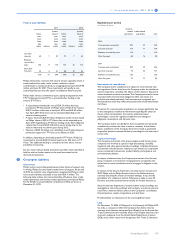
The Company believes that an understanding of the Philips Group’s
financial condition is enhanced by the disclosure of net operating capital
(NOC), as this figure is used by Philips’ management to evaluate the
capital efficiency of the Philips Group and its operating sectors. NOC
is defined as: total assets excluding assets from discontinued operations
less: (a) cash and cash equivalents, (b) deferred tax assets, (c) other
(non-)current financial assets, (d) investments in associates, and after
deduction of: (e) provisions excluding deferred tax liabilities, (f)
accounts and notes payable, (g) accrued liabilities, (h) current/non-
current liabilities, and (i) trading securities.
Net debt is defined as the sum of long- and short-term debt minus cash
and cash equivalents. The net debt position as a percentage of the sum
of group equity (shareholders’ equity and non-controlling interests) and
net debt is presented to express the financial strength of the Company.
This measure is widely used by management and investment analysts
and is therefore included in the disclosure. Our net debt position is
managed in such a way that we can meet our objective to retain our
target at A3 rating (Moody’s) and A- rating (Standard and Poor’s).
Furthermore, the Group’s objective when managing the net debt
position is to fulfill our commitment to a stable dividend policy with a
40% to 50% pay-out of continuing net income.
Cash flows before financing activities, being the sum total of net cash
from operating activities and net cash from investing activities, and free
cash flow, being net cash from operating activities minus net capital
expenditures, are presented separately to facilitate the reader’s
understanding of the Company’s funding requirements.
NOC composition
2010 2011 2012
Intangible assets 12,233 11,012 10,679
Property, plant and equipment 3,145 3,014 2,959
Remaining assets 9,347 9,393 8,921
Provisions (2,394) (2,694) (2,969)
Other liabilities (10,434) (10,353) (10,283)
Net operating capital 11,897 10,372 9,307
Composition of net debt to group equity
2010 2011 2012
Long-term debt 2,818 3,278 3,725
Short-term debt 1,840 582 809
Total debt 4,658 3,860 4,534
Cash and cash equivalents 5,833 3,147 3,834
Net debt (cash)1) (1,175) 713 700
Shareholders’ equity 15,007 12,316 11,140
Non-controlling interests 46 34 34
Group equity 15,053 12,350 11,174
Net debt and group equity 13,878 13,063 11,874
Net debt divided by net debt and group equity (in %) (8) 5 6
Group equity divided by net debt and group equity (in %) 108 95 94
1) Total debt less cash and cash equivalents
Composition of cash flows
2010 2011 2012
Cash flows from operating activities 2,074 768 2,198
Cash flows from investing activities (597) (1,293) (912)
Cash flows before financing activities 1,477 (525) 1,286
Cash flows from operating activities 2,074 768 2,198
Net capital expenditures: (716) (872) (475)
Purchase of intangible assets (53) (69) (39)
Proceeds from sale of intangible assets − − 160
Expenditures on development assets (220) (278) (347)
Capital expenditures on property, plant and equipment (572) (653) (675)
Proceeds from disposals of property, plant and equipment 129 128 426
Free cash flows 1,358 (104) 1,723