Philips 2012 Annual Report Download - page 78
Download and view the complete annual report
Please find page 78 of the 2012 Philips annual report below. You can navigate through the pages in the report by either clicking on the pages listed below, or by using the keyword search tool below to find specific information within the annual report.-
 1
1 -
2
-
3
-
4
-
5
-
6
-
7
-
8
-
9
-
10
-
11
-
12
-
13
-
14
-
15
-
16
-
17
-
18
-
19
-
20
-
21
-
22
-
23
-
24
-
25
-
26
-
27
-
28
-
29
-
30
-
31
-
32
-
33
-
34
-
35
-
36
-
37
-
38
-
39
-
40
-
41
-
42
-
43
-
44
-
45
-
46
-
47
-
48
-
49
-
50
-
51
-
52
-
53
-
54
-
55
-
56
-
57
-
58
-
59
-
60
-
61
-
62
-
63
-
64
-
65
-
66
-
67
-
 68
68 -
 69
69 -
 70
70 -
 71
71 -
 72
72 -
 73
73 -
 74
74 -
 75
75 -
 76
76 -
 77
77 -
 78
78 -
 79
79 -
 80
80 -
 81
81 -
 82
82 -
 83
83 -
 84
84 -
 85
85 -
 86
86 -
 87
87 -
 88
88 -
89
-
90
-
91
-
92
-
93
-
94
-
95
-
96
-
97
-
98
-
99
-
100
-
101
-
102
-
103
-
104
-
105
-
106
-
107
-
108
-
109
-
110
-
111
-
112
-
113
-
114
-
115
-
116
-
117
-
118
-
119
-
120
-
121
-
122
-
123
-
124
-
125
-
126
-
127
-
128
-
129
-
130
-
131
-
132
-
133
-
134
-
135
-
136
-
137
-
138
-
139
-
140
-
141
-
142
-
143
-
144
-
145
-
146
-
147
-
148
-
149
-
150
-
151
-
152
-
153
-
154
-
155
-
156
-
157
-
158
-
159
-
160
-
161
-
162
-
163
-
164
-
165
-
166
-
167
-
168
-
169
-
170
-
171
-
172
-
173
-
174
-
175
-
176
-
177
-
178
-
179
-
180
-
181
-
182
-
183
-
184
-
185
-
186
-
187
-
188
-
189
-
190
-
191
-
192
-
193
-
194
-
195
-
196
-
197
-
198
-
199
-
200
-
201
-
202
-
203
-
204
-
205
-
206
-
207
-
208
-
209
-
210
-
211
-
212
-
213
-
214
-
215
-
216
-
217
-
218
-
219
-
220
-
221
-
222
-
223
-
224
-
225
-
226
-
227
-
228
-
229
-
230
-
231
 |
 |

6 Sector performance 6.3.4 - 6.3.5
78 Annual Report 2012
Address cost base, margin management
and working capital
In 2012, as part of our organizational redesign and cost
program, we took a fundamental approach to increase the
speed and efficiency of our organization. We reduced the
number of Business Groups from six to five. Regional
layers have been simplified and regional teams no longer
sit between markets and businesses. Significant reductions
in overhead functions like IT, Human Resource
Management and Finance & Accounting have been
implemented. Furthermore, we have endeavored to
optimize our industrial asset base for maximum efficiency
and lowest cost. We have reduced our industrial footprint
by 40% compared to 2008, with four sites closed and four
divested in 2012.
To protect our margins, we further improved our
product mix and implemented selective price increases,
mainly in our conventional lamps and luminaires
businesses, and also managed cost aggressively. While we
continue to invest in innovation and our go-to market
capabilities, we will continue to focus on overhead cost
reductions and accelerate the rationalization of our
industrial footprint.
Our focus on working capital management is clearly
paying off. Tight management of the value and quality of
inventory led to a year-on-year improvement of 1.9% of
sales.
Deliver on turnaround of Lumileds and
Consumer Luminaires
Good progress has been made towards turning around
our Lumileds and Consumer Luminaires businesses. Both
managed to achieve a return to profitability – excluding
restructuring and acquisition-related charges – in Q4
2012. At Lumileds, actions have been taken to improve
manufacturing yields and innovation effectiveness. Also,
the go-to-market and distribution structure has been
expanded and strengthened, resulting in incremental top-
line growth. At Consumer Luminaires, successful actions
have been taken to improve customer intimacy and our
go-to-market strategy. In addition, actions have been
taken to improve productivity and to improve the end-to-
end supply chain costs. In China and India in particular, we
have experienced strong growth with continued
expansion of branded Philips Lighting stores and shop-in-
shops.
Deliver on EcoVision sustainability
commitments
In 2012, Philips Lighting invested EUR 325 million in Green
Innovation, compared to EUR 291 million in 2011. Major
investments have been made in energy-saving
technologies such as OLED and lighting controls and in
the reduction of regulated substances in our product
portfolio.The energy efficiency of our total product
portfolio improved from 36 to 38 lm/W, mainly because
of the shift to LED lighting. Within the Green Operations
2015 program, we are on track to meet our commitments
to reduce Lighting’s environmental footprint. By using
renewable energy and implementing energy-saving
programs in our major operational sites, we have already
reduced our carbon footprint by 23%. Currently 78% of
our total waste is re-used as a result of recycling.
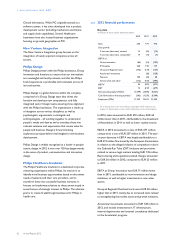
6.3.5 2012 financial performance
Key data
in millions of euros unless otherwise stated
2010 2011 2012
Sales 7,552 7,638 8,442
Sales growth
% increase, nominal 15 1 11
% increase, comparable1) 9 6 4
EBITA1) 863 445 188
as a % of sales 11.4 5.8 2.2
EBIT 689 (362) (6)
as a % of sales 9.1 (4.7) (0.1)
Net operating capital (NOC)1) 5,506 4,965 4,635
Cash flows before financing activities1) 590 254 339
Employees (FTEs) 53,888 53,168 50,224
1) For a reconciliation to the most directly comparable GAAP measures, see
chapter 15, Reconciliation of non-GAAP information, of this Annual Report
Sales amounted to EUR 8,442 million, a nominal increase
of 11% compared to 2011, mainly driven by growth at
Light Sources & Electronics and Professional Lighting
Solutions, but tempered by a sales decline at Lumileds.
Excluding a 5% favorable currency impact and a 2% impact
from portfolio changes, comparable sales increased by 4%.
The year-on-year sales increase was substantially driven
by growth geographies, which grew 7% on a comparable
basis. As a proportion of total sales, sales in growth
geographies increased slightly to 41% of total Lighting
sales, driven by double-digit growth in China and India,
compared to 40% in 2011. In mature geographies, sales
growth was limited to low single-digits due to lower
demand in North America and Western Europe,
particularly for Professional Lighting Solutions and
Consumer Luminaires.