Philips 2012 Annual Report Download - page 139
Download and view the complete annual report
Please find page 139 of the 2012 Philips annual report below. You can navigate through the pages in the report by either clicking on the pages listed below, or by using the keyword search tool below to find specific information within the annual report.-
 1
1 -
2
-
3
-
4
-
5
-
6
-
7
-
8
-
9
-
10
-
11
-
12
-
13
-
14
-
15
-
16
-
17
-
18
-
19
-
20
-
21
-
22
-
23
-
24
-
25
-
26
-
27
-
28
-
29
-
30
-
31
-
32
-
33
-
34
-
35
-
36
-
37
-
38
-
39
-
40
-
41
-
42
-
43
-
44
-
45
-
46
-
47
-
48
-
49
-
50
-
51
-
52
-
53
-
54
-
55
-
56
-
57
-
58
-
59
-
60
-
61
-
62
-
63
-
64
-
65
-
66
-
67
-
68
-
69
-
70
-
71
-
72
-
73
-
74
-
75
-
76
-
77
-
78
-
79
-
80
-
81
-
82
-
83
-
84
-
85
-
86
-
87
-
88
-
89
-
90
-
91
-
92
-
93
-
94
-
95
-
96
-
97
-
98
-
99
-
100
-
101
-
102
-
103
-
104
-
105
-
106
-
107
-
108
-
109
-
110
-
111
-
112
-
113
-
114
-
115
-
116
-
117
-
118
-
119
-
120
-
121
-
122
-
123
-
124
-
125
-
126
-
127
-
128
-
 129
129 -
 130
130 -
 131
131 -
 132
132 -
 133
133 -
 134
134 -
 135
135 -
 136
136 -
 137
137 -
 138
138 -
 139
139 -
 140
140 -
 141
141 -
 142
142 -
 143
143 -
 144
144 -
 145
145 -
 146
146 -
 147
147 -
 148
148 -
 149
149 -
150
-
151
-
152
-
153
-
154
-
155
-
156
-
157
-
158
-
159
-
160
-
161
-
162
-
163
-
164
-
165
-
166
-
167
-
168
-
169
-
170
-
171
-
172
-
173
-
174
-
175
-
176
-
177
-
178
-
179
-
180
-
181
-
182
-
183
-
184
-
185
-
186
-
187
-
188
-
189
-
190
-
191
-
192
-
193
-
194
-
195
-
196
-
197
-
198
-
199
-
200
-
201
-
202
-
203
-
204
-
205
-
206
-
207
-
208
-
209
-
210
-
211
-
212
-
213
-
214
-
215
-
216
-
217
-
218
-
219
-
220
-
221
-
222
-
223
-
224
-
225
-
226
-
227
-
228
-
229
-
230
-
231
 |
 |

12 Group financial statements 12.10 - 12.11 1
Annual Report 2012 139
12.11 Notes
all amounts in millions of euros unless otherwise stated
Prior periods amounts have been revised to reflect certain voluntary
adopted accounting policy changes, and immaterial adjustments (see
section 12.10, Significant accounting policies, of this Annual Report).
Discontinued operations reflect the effect of classifying the Television
business as discontinued operations in 2011, for which the previous
years’ results and cash flows have been restated. Movement schedules
of balance sheet items include items from continuing and discontinued
operations and therefore cannot be reconciled to income from
continuing operations and cash flow from continuing operations only.
Notes to the Consolidated financial statements of the Philips
Group
1Income from operations
For information related to Sales and Income from operations on a
geographical and sector basis, see section 12.9, Information by sector
and main country, of this Annual Report.
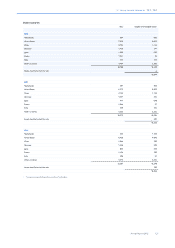
Sales and costs by nature
2010 2011 2012
Sales 22,287 22,579 24,788
Costs of materials used (7,614) (8,100) (9,009)
Employee benefit expenses (5,777) (6,053) (6,933)
Depreciation and amortization (1,343) (1,454) (1,433)
Shipping and handling1) (931) (857) (854)
Advertising and promotion (835) (938) (890)
Lease expense (297) (320) (370)2)
Audit fees (20) (19) (22)
Other operational costs (3,462) (3,802) (3,944)
Impairment of goodwill − (1,355) −
Other business income and expenses 66 50 (303)
Income from operations 2,074 (269) 1,030
1) Revised to reflect an adjusted presentation of shipping and handling costs
2) Lease expense includes EUR 35 million of other costs, such as fuel and
electricity, and taxes to be paid and reimbursed to the lessor
Sales composition
2010 2011 2012
Goods 18,904 19,222 21,248
Services 2,867 2,926 3,130
Royalties 516 431 410
22,287 22,579 24,788
Philips has no single external customer that represents 10% or more
of revenues and therefore no further information is disclosed.
Costs of materials used
Cost of materials used represents the inventory recognized in cost of
sales.
Employee benefit expenses
2010 2011 2012
Salaries and wages 5,035 5,123 5,974
Pension costs 8 138 104
Other social security and similar charges:
- Required by law 571 612 693
- Voluntary 163 180 162
5,777 6,053 6,933
For further information on pension costs, see note 29, Pensions and
other postretirement benefits.
Details on the remuneration of the members of the Board of
Management and the Supervisory Board, see note 32, Information on
remuneration.
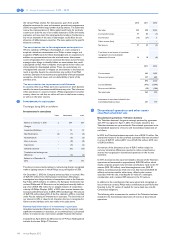
Employees
The average number of employees by category is summarized as follows
(in FTEs):
2010 2011 2012
Production 56,005 57,804 58,613
Research & development 11,817 12,941 13,378
Other 32,354 33,033 33,855
Permanent employees 100,176 103,778 105,846
Temporary employees 13,040 16,207 15,575
Continuing operations 113,216 119,985 121,421
Discontinued operations 4,355 3,545 2,982
Depreciation and amortization
Depreciation of property, plant and equipment and amortization of
intangibles are as follows:
2010 2011 2012
Depreciation of property, plant and
equipment 630 632 696
Amortization of internal-use software 62 55 45
Amortization of other intangible assets 482 594 472
Amortization of development costs 169 173 220
1,343 1,454 1,433
Depreciation of property, plant and equipment and amortization
(including impairment) of software is primarily included in cost of sales.
Amortization of the categories of other intangible assets are reported
in selling expenses for brand names and customer relationships and are
reported in cost of sales for technology based and other intangible
assets. Amortization (including impairment) of development cost is
included in research and development expenses.
Shipping and handling
Shipping and handling costs are included in cost of sales and selling
expenses (see section 12.10, Significant accounting policies, of this
Annual Report for more information).
Advertising and promotion
Advertising and promotion costs are included in selling expenses.