Philips 2012 Annual Report Download - page 128
Download and view the complete annual report
Please find page 128 of the 2012 Philips annual report below. You can navigate through the pages in the report by either clicking on the pages listed below, or by using the keyword search tool below to find specific information within the annual report.-
 1
1 -
2
-
3
-
4
-
5
-
6
-
7
-
8
-
9
-
10
-
11
-
12
-
13
-
14
-
15
-
16
-
17
-
18
-
19
-
20
-
21
-
22
-
23
-
24
-
25
-
26
-
27
-
28
-
29
-
30
-
31
-
32
-
33
-
34
-
35
-
36
-
37
-
38
-
39
-
40
-
41
-
42
-
43
-
44
-
45
-
46
-
47
-
48
-
49
-
50
-
51
-
52
-
53
-
54
-
55
-
56
-
57
-
58
-
59
-
60
-
61
-
62
-
63
-
64
-
65
-
66
-
67
-
68
-
69
-
70
-
71
-
72
-
73
-
74
-
75
-
76
-
77
-
78
-
79
-
80
-
81
-
82
-
83
-
84
-
85
-
86
-
87
-
88
-
89
-
90
-
91
-
92
-
93
-
94
-
95
-
96
-
97
-
98
-
99
-
100
-
101
-
102
-
103
-
104
-
105
-
106
-
107
-
108
-
109
-
110
-
111
-
112
-
113
-
114
-
115
-
116
-
117
-
 118
118 -
 119
119 -
 120
120 -
 121
121 -
 122
122 -
 123
123 -
 124
124 -
 125
125 -
 126
126 -
 127
127 -
 128
128 -
 129
129 -
 130
130 -
 131
131 -
 132
132 -
 133
133 -
 134
134 -
 135
135 -
 136
136 -
 137
137 -
 138
138 -
139
-
140
-
141
-
142
-
143
-
144
-
145
-
146
-
147
-
148
-
149
-
150
-
151
-
152
-
153
-
154
-
155
-
156
-
157
-
158
-
159
-
160
-
161
-
162
-
163
-
164
-
165
-
166
-
167
-
168
-
169
-
170
-
171
-
172
-
173
-
174
-
175
-
176
-
177
-
178
-
179
-
180
-
181
-
182
-
183
-
184
-
185
-
186
-
187
-
188
-
189
-
190
-
191
-
192
-
193
-
194
-
195
-
196
-
197
-
198
-
199
-
200
-
201
-
202
-
203
-
204
-
205
-
206
-
207
-
208
-
209
-
210
-
211
-
212
-
213
-
214
-
215
-
216
-
217
-
218
-
219
-
220
-
221
-
222
-
223
-
224
-
225
-
226
-
227
-
228
-
229
-
230
-
231
 |
 |

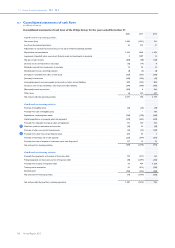
12 Group financial statements 12.9 - 12.9
128 Annual Report 2012
Sectors
total assets
net operating
capital
total liabilities
excl. debt
current accounts
receivable, net
tangible and
intangible assets
depreciation and
amortization1)
capital
expenditures
2012
Healthcare 11,248 7,976 3,185 1,967 7,130 (543) 135
Consumer Lifestyle 3,325 1,217 2,108 892 1,699 (234) 146
Lighting 6,970 4,635 2,313 1,364 4,293 (543) 290
Innovation, Group & Services 7,493 (4,521) 5,738 111 516 (113) 104
29,036 9,307 13,344 4,334 13,638 (1,433) 675
Assets classified as held for sale 43 27
29,079 13,371
2011
Healthcare 11,591 8,418 3,087 1,882 7,479 (538) 153
Consumer Lifestyle 3,841 884 2,954 1,339 1,755 (224) 148
Lighting 6,914 4,965 1,927 1,261 4,320 (570) 279
Innovation, Group & Services 6,498 (3,895) 5,156 102 472 (122) 73
28,844 10,372 13,124 4,584 14,026 (1,454) 653
Assets classified as held for sale 551 61
29,395 13,185
2010
Healthcare 11,962 8,908 2,978 1,848 8,194 (549) 130
Consumer Lifestyle 4,110 882 3,227 1,335 1,525 (195) 115
of which Television 1,010 (305) 1,315 494 70
Lighting 7,495 5,506 1,972 1,188 5,014 (458) 273
Innovation, Group & Services 9,023 (3,399) 4,822 158 645 (141) 54
32,590 11,897 12,999 4,529 15,378 (1,343) 572
Assets classified as held for sale 120
32,710
1) Includes impairments of tangible and intangible assets excluding goodwill
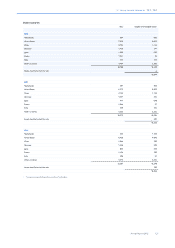
Goodwill assigned to sectors
carrying value
at
January 1 acquisitions divestments impairment
transfer to
assets
classified as
held for sale
translation
differences and
other changes
carrying value
at
December 31
2012
Healthcare 4,703 (1) − − − (129) 4,573
Consumer Lifestyle 674 (1) (6) − − 1 668
Lighting 1,639 100 − − − (32) 1,707
Innovation, Group & Services − − − − − − −
7,016 98 (6) − − (160) 6,948
2011
Healthcare 5,381 64 (3) (824) (2) 87 4,703
Consumer Lifestyle 532 131 (5) − (3) 19 674
Lighting 2,122 30 − (531) − 18 1,639
Innovation, Group & Services − − − − − − −
8,035 225 (8) (1,355) (5) 124 7,016