Philips 2012 Annual Report Download - page 175
Download and view the complete annual report
Please find page 175 of the 2012 Philips annual report below. You can navigate through the pages in the report by either clicking on the pages listed below, or by using the keyword search tool below to find specific information within the annual report.-
 1
1 -
2
-
3
-
4
-
5
-
6
-
7
-
8
-
9
-
10
-
11
-
12
-
13
-
14
-
15
-
16
-
17
-
18
-
19
-
20
-
21
-
22
-
23
-
24
-
25
-
26
-
27
-
28
-
29
-
30
-
31
-
32
-
33
-
34
-
35
-
36
-
37
-
38
-
39
-
40
-
41
-
42
-
43
-
44
-
45
-
46
-
47
-
48
-
49
-
50
-
51
-
52
-
53
-
54
-
55
-
56
-
57
-
58
-
59
-
60
-
61
-
62
-
63
-
64
-
65
-
66
-
67
-
68
-
69
-
70
-
71
-
72
-
73
-
74
-
75
-
76
-
77
-
78
-
79
-
80
-
81
-
82
-
83
-
84
-
85
-
86
-
87
-
88
-
89
-
90
-
91
-
92
-
93
-
94
-
95
-
96
-
97
-
98
-
99
-
100
-
101
-
102
-
103
-
104
-
105
-
106
-
107
-
108
-
109
-
110
-
111
-
112
-
113
-
114
-
115
-
116
-
117
-
118
-
119
-
120
-
121
-
122
-
123
-
124
-
125
-
126
-
127
-
128
-
129
-
130
-
131
-
132
-
133
-
134
-
135
-
136
-
137
-
138
-
139
-
140
-
141
-
142
-
143
-
144
-
145
-
146
-
147
-
148
-
149
-
150
-
151
-
152
-
153
-
154
-
155
-
156
-
157
-
158
-
159
-
160
-
161
-
162
-
163
-
164
-
 165
165 -
 166
166 -
 167
167 -
 168
168 -
 169
169 -
 170
170 -
 171
171 -
 172
172 -
 173
173 -
 174
174 -
 175
175 -
 176
176 -
 177
177 -
 178
178 -
 179
179 -
 180
180 -
 181
181 -
 182
182 -
 183
183 -
 184
184 -
 185
185 -
186
-
187
-
188
-
189
-
190
-
191
-
192
-
193
-
194
-
195
-
196
-
197
-
198
-
199
-
200
-
201
-
202
-
203
-
204
-
205
-
206
-
207
-
208
-
209
-
210
-
211
-
212
-
213
-
214
-
215
-
216
-
217
-
218
-
219
-
220
-
221
-
222
-
223
-
224
-
225
-
226
-
227
-
228
-
229
-
230
-
231
 |
 |

12 Group financial statements 12.11 - 12.11 34
Annual Report 2012 175
The fair value of derivatives is calculated as the present value of the
estimated future cash flows based on observable interest yield curves,
basis spread and foreign exchange rates.
The valuation of convertible bond instruments uses observable market
quoted data for the options and present value calculations using
observable yield curves for the fair value of the bonds.
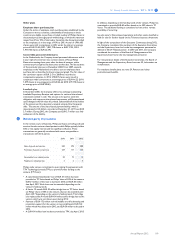
Level 3
If one or more of the significant inputs are not based on observable
market data, the instrument is included in level 3. The arrangement with
the UK Pension Fund in conjunction with the sale of NXP is a financial
instrument carried at fair value classified as level 3. At the end of 2012,
the fair value of this instrument is estimated to be EUR 14 million with
the changes of fair value recorded to financial income and expense.
Please refer to note 12, Other non-current financial assets for more
details.
Furthermore, deferred consideration and loan extension options to TP
Vision are also included in level 3.
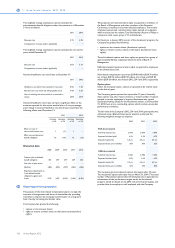
The table below shows the reconciliation from the beginning balance
to the end balance for fair value measured in Level 3 of the fair value
hierarchy.
financial assets financial liabilities
Balance at January 1, 2012 44 −
Total gains and losses
recognised in:
- profit or loss 11 (11)
- other comprehensive
income 7 −
Balance at December 31, 2012 62 (11)
34 Details of treasury risks
Philips is exposed to several types of financial risk. This note further
analyzes financial risks. Philips does not purchase or hold derivative
financial instruments for speculative purposes. Information regarding
financial instruments is included in note 33, Fair value of financial assets
and liabilities.
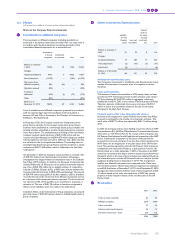
Liquidity risk
Liquidity risk is the risk that an entity will encounter difficulty in meeting
obligations associated with financial liabilities.
Liquidity risk for the group is monitored through the Treasury liquidity
committee which tracks the development of the actual cash flow
position for the group and uses input from a number of sources in order
to forecast the overall liquidity position both on a short and long term
basis. Corporate Treasury invests surplus cash in money market
deposits with appropriate maturities to ensure sufficient liquidity is
available to meet liabilities when due.
The rating of the Company’s debt by major rating services may improve
or deteriorate. As a result, Philips’ future borrowing capacity may be
influenced and its financing costs may fluctuate. Philips has various
sources to mitigate the liquidity risk for the group. At December 31,
2012, Philips had EUR 3,834 million in cash and cash equivalents (2011:
EUR 3,147 million), within which short-term deposits of EUR 3,177
million (2011: EUR 2,422 million) and other liquid assets of EUR 120
million (2011: EUR 119 million). Philips pools cash from subsidiaries to
the extent legally and economically feasible; cash not pooled remains
available for operational or investment needs by the Company.
Furthermore, Philips has a USD 2.5 billion Commercial Paper Program
and a EUR 1.8 billion revolving credit facility that can be used for general
corporate purpose and as a backstop for its commercial paper program.
In January 2013 the EUR 1.8 billion facility was extended by 2 years until
February 18, 2018. The facility has no financial covenants and repetitive
material adverse change clauses and can be used for general corporate
purposes. As of December 31, 2012, Philips did not have any amounts
outstanding under any of these facilities. Additionally Philips also held
EUR 120 million of equity investments in available-for-sale financial
assets (fair value at December 31, 2012).
Currency risk
Currency risk is the risk that the fair value or future cash flows of a
financial instrument will fluctuate because of changes in foreign
exchange rates. Currency fluctuations may impact Philips’ financial
results. Philips is exposed to currency risk in the following areas:
• Transaction exposures, related to forecasted sales and purchases
and on-balance-sheet receivables/payables resulting from such
transactions
• Translation exposure of net income in foreign entities
• Translation exposure of foreign-currency intercompany and
external debt and deposits
• Translation exposure of foreign-currency-denominated equity
invested in consolidated companies
• Translation exposure to equity interests in non-functional-
currency investments in associates and available-for-sale financial
assets.
It is Philips’ policy that significant transaction exposures are hedged by
the businesses. Accordingly, all businesses are required to identify and
measure their exposures resulting from material transactions
denominated in currencies other than their own functional currency.
Philips’ policy generally requires committed foreign currency exposures
to be fully hedged using forwards. Anticipated transactions may be
hedged using forwards or options or a combination thereof. The
amount hedged as a proportion of the total anticipated exposure
identified varies per business and is a function of the ability to project
cash flows, the time horizon for the cash flows and the way in which
the businesses can adapt to changing levels of foreign-currency
exchange rates. As a result, hedging activities cannot and will not
eliminate all currency risks for these anticipated transaction exposures.
Generally, the maximum tenor of these hedges is 18 months.