Philips 2012 Annual Report Download - page 125
Download and view the complete annual report
Please find page 125 of the 2012 Philips annual report below. You can navigate through the pages in the report by either clicking on the pages listed below, or by using the keyword search tool below to find specific information within the annual report.-
 1
1 -
2
-
3
-
4
-
5
-
6
-
7
-
8
-
9
-
10
-
11
-
12
-
13
-
14
-
15
-
16
-
17
-
18
-
19
-
20
-
21
-
22
-
23
-
24
-
25
-
26
-
27
-
28
-
29
-
30
-
31
-
32
-
33
-
34
-
35
-
36
-
37
-
38
-
39
-
40
-
41
-
42
-
43
-
44
-
45
-
46
-
47
-
48
-
49
-
50
-
51
-
52
-
53
-
54
-
55
-
56
-
57
-
58
-
59
-
60
-
61
-
62
-
63
-
64
-
65
-
66
-
67
-
68
-
69
-
70
-
71
-
72
-
73
-
74
-
75
-
76
-
77
-
78
-
79
-
80
-
81
-
82
-
83
-
84
-
85
-
86
-
87
-
88
-
89
-
90
-
91
-
92
-
93
-
94
-
95
-
96
-
97
-
98
-
99
-
100
-
101
-
102
-
103
-
104
-
105
-
106
-
107
-
108
-
109
-
110
-
111
-
112
-
113
-
114
-
 115
115 -
 116
116 -
 117
117 -
 118
118 -
 119
119 -
 120
120 -
 121
121 -
 122
122 -
 123
123 -
 124
124 -
 125
125 -
 126
126 -
 127
127 -
 128
128 -
 129
129 -
 130
130 -
 131
131 -
 132
132 -
 133
133 -
 134
134 -
 135
135 -
136
-
137
-
138
-
139
-
140
-
141
-
142
-
143
-
144
-
145
-
146
-
147
-
148
-
149
-
150
-
151
-
152
-
153
-
154
-
155
-
156
-
157
-
158
-
159
-
160
-
161
-
162
-
163
-
164
-
165
-
166
-
167
-
168
-
169
-
170
-
171
-
172
-
173
-
174
-
175
-
176
-
177
-
178
-
179
-
180
-
181
-
182
-
183
-
184
-
185
-
186
-
187
-
188
-
189
-
190
-
191
-
192
-
193
-
194
-
195
-
196
-
197
-
198
-
199
-
200
-
201
-
202
-
203
-
204
-
205
-
206
-
207
-
208
-
209
-
210
-
211
-
212
-
213
-
214
-
215
-
216
-
217
-
218
-
219
-
220
-
221
-
222
-
223
-
224
-
225
-
226
-
227
-
228
-
229
-
230
-
231
 |
 |

12 Group financial statements 12.7 - 12.7
Annual Report 2012 125
2010 2011 2012
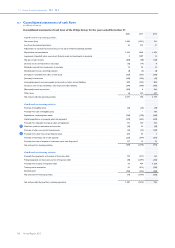
Cash flows from discontinued operations
Net cash provided by (used for) operating activities 34 (270) (296)
Net cash provided by (used for) investing activities (56) (94) 40
Net cash provided by (used for) discontinued operations (22) (364) (256)
Net cash provided by (used for) continuing and discontinued operations 1,358 (2,679) 738
Effect of changes in exchange rates on cash and cash equivalents 89 (7) (51)
Cash and cash equivalents at the beginning of the year 4,386 5,833 3,147
Cash and cash equivalents at the end of the year 5,833 3,147 3,834
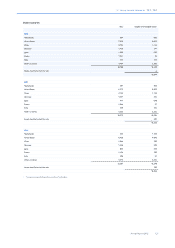
Supplemental disclosures to the Consolidated statements of cash flows
2010 2011 2012
Net cash paid during the year for:
Pensions (474) (639) (610)
Interest (226) (231) (239)
Income taxes (206) (582) (359)
Net gain on sale of assets:
Cash proceeds from the sale of assets 514 234 622
Book value of these assets (667) (164) (434)
Deferred results on sale and leaseback transactions (4) − (25)
Non-cash proceeds 361 18 −
204 88 163
Non-cash investing and financing information
Assets in lieu of cash from the sale of businesses:
28
Shares/share options/convertible bonds (continuing operations) 3 18 −
Shares/share options/convertible bonds (discontinued operations) − − 17
Conversion of convertible personnel debentures 6 − 4
Treasury shares transaction:
Shares acquired − (751) (816)
Exercise of stock options 65 80 48
Prior periods amounts have been revised to reflect immaterial adjustments (see section 12.10, Significant accounting policies, of this Annual Report).
The accompanying notes are an integral part of these consolidated financial statements.
For a number of reasons, principally the effects of translation differences and consolidation changes, certain items in the statements of cash flows do not correspond to the
differences between the balance sheet amounts for the respective items.