Philips 2012 Annual Report Download - page 37
Download and view the complete annual report
Please find page 37 of the 2012 Philips annual report below. You can navigate through the pages in the report by either clicking on the pages listed below, or by using the keyword search tool below to find specific information within the annual report.-
 1
1 -
2
-
3
-
4
-
5
-
6
-
7
-
8
-
9
-
10
-
11
-
12
-
13
-
14
-
15
-
16
-
17
-
18
-
19
-
20
-
21
-
22
-
23
-
24
-
25
-
26
-
 27
27 -
 28
28 -
 29
29 -
 30
30 -
 31
31 -
 32
32 -
 33
33 -
 34
34 -
 35
35 -
 36
36 -
 37
37 -
 38
38 -
 39
39 -
 40
40 -
 41
41 -
 42
42 -
 43
43 -
 44
44 -
 45
45 -
 46
46 -
 47
47 -
48
-
49
-
50
-
51
-
52
-
53
-
54
-
55
-
56
-
57
-
58
-
59
-
60
-
61
-
62
-
63
-
64
-
65
-
66
-
67
-
68
-
69
-
70
-
71
-
72
-
73
-
74
-
75
-
76
-
77
-
78
-
79
-
80
-
81
-
82
-
83
-
84
-
85
-
86
-
87
-
88
-
89
-
90
-
91
-
92
-
93
-
94
-
95
-
96
-
97
-
98
-
99
-
100
-
101
-
102
-
103
-
104
-
105
-
106
-
107
-
108
-
109
-
110
-
111
-
112
-
113
-
114
-
115
-
116
-
117
-
118
-
119
-
120
-
121
-
122
-
123
-
124
-
125
-
126
-
127
-
128
-
129
-
130
-
131
-
132
-
133
-
134
-
135
-
136
-
137
-
138
-
139
-
140
-
141
-
142
-
143
-
144
-
145
-
146
-
147
-
148
-
149
-
150
-
151
-
152
-
153
-
154
-
155
-
156
-
157
-
158
-
159
-
160
-
161
-
162
-
163
-
164
-
165
-
166
-
167
-
168
-
169
-
170
-
171
-
172
-
173
-
174
-
175
-
176
-
177
-
178
-
179
-
180
-
181
-
182
-
183
-
184
-
185
-
186
-
187
-
188
-
189
-
190
-
191
-
192
-
193
-
194
-
195
-
196
-
197
-
198
-
199
-
200
-
201
-
202
-
203
-
204
-
205
-
206
-
207
-
208
-
209
-
210
-
211
-
212
-
213
-
214
-
215
-
216
-
217
-
218
-
219
-
220
-
221
-
222
-
223
-
224
-
225
-
226
-
227
-
228
-
229
-
230
-
231
 |
 |

5 Group performance 5.1.3 - 5.1.3
Annual Report 2012 37
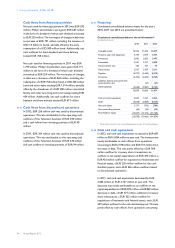
Sales, EBIT and EBITA
in millions of euros unless otherwise stated
sales EBIT % EBITA1) %
2012
Healthcare 9,983 1,122 11.2 1,322 13.2
Consumer Lifestyle 5,953 593 10.0 663 11.1
Lighting 8,442 (6) (0.1) 188 2.2
IG&S 410 (679) − (671) −
Philips Group 24,788 1,030 4.2 1,502 6.1
2011
Healthcare 8,852 93 1.1 1,145 12.9
Consumer Lifestyle 5,615 217 3.9 297 5.3
Lighting 7,638 (362) (4.7) 445 5.8
IG&S 474 (217) − (207) −
Philips Group 22,579 (269) (1.2) 1,680 7.4
1) For a reconciliation to the most directly comparable GAAP measures, see
chapter 15, Reconciliation of non-GAAP information, of this Annual Report
In 2012, EBIT increased by EUR 1,299 million compared
to 2011, to EUR 1,030 million, or 4.2% of sales. 2012
included EUR 580 million in restructuring and acquisition-
related charges, compared to EUR 163 million in 2011.
The year-on-year increase was mainly attributable to
goodwill impairments of EUR 1,355 million in 2011 and
higher gross margin percentages in Healthcare and
Consumer Lifestyle, but was partly offset by a EUR 313
million fine issued by the European Commission in
relation to the alleged violation of competition rules in the
Cathode-Ray Tube (CRT) industry.
Amortization of intangibles, excluding software,
capitalized product development and impairment related
charges, amounted to EUR 472 million in 2012, compared
to EUR 594 million in 2011.
EBITA decreased from EUR 1,680 million, or 7.4% of sales,
in 2011 to EUR 1,502 million, or 6.1% of sales, in 2012.
EBITA was higher than in 2011 at Consumer Lifestyle and
Healthcare, while Lighting was lower.
Healthcare
EBITA increased from EUR 1,145 million, or 12.9% of
sales, in 2011 to EUR 1,322 million, or 13.2% of sales, in
2012. EBITA improvements were realized across all
businesses, largely as a result of higher sales and reduced
expenses resulting from cost-saving programs.
Restructuring and acquisition-related charges totaled
EUR 134 million, compared to EUR 20 million in 2011.
Consumer Lifestyle
EBITA increased from EUR 297 million, or 5.3% of sales,
in 2011 to EUR 663 million, or 11.1% of sales, in 2012.
Restructuring and acquisition-related charges amounted
to EUR 75 million in 2012, compared to EUR 54 million
in 2011. 2012 results included a EUR 160 million one-
time gain from the extension of our partnership with Sara
Lee, including the transfer of our 50% ownership rights to
the Senseo trademark. Excluding this one-time gain, the
year-on-year EBITA increase was driven by higher sales
across all growth businesses as well as lower net costs
formerly reported as part of the Television business.
EBITA was higher than in 2011 in all businesses.
Lighting
EBITA decreased from EUR 445 million, or 5.8% of sales,
in 2011 to EUR 188 million, or 2.2% of sales, in 2012.
Restructuring and acquisition-related charges amounted
to EUR 315 million in 2012, compared to EUR 66 million in
2011. The decrease in EBITA was mainly attributable to
higher restructuring and acquisition-related charges, as
well as losses on the sale of industrial assets amounting to
EUR 81 million, partly offset by higher sales. Compared
to 2011, EBITA declined in all businesses except
Automotive.
Innovation, Group & Services
EBITA decreased from a loss of EUR 207 million in 2011
to a loss of EUR 671 million in 2012. Results in 2012 were
negatively impacted by a charge of EUR 313 million related
to the CRT fine and provisions related to various legal
matters totaling EUR 132 million. EBITA in 2012 also
includes a EUR 25 million gain from a change in a medical
retiree benefit plan and a EUR 37 million gain on the sale of
the High Tech Campus, while 2011 included a EUR 21
million gain related to a change in pension plan.
Restructuring and acquisition-related charges amounted
to EUR 56 million in 2012, compared to EUR 23 million
in 2011.
For further information regarding the performance of the
sectors, see chapter 6, Sector performance, of this Annual
Report.
5.1.3 Marketing
Philips’ total 2012 marketing expenses approximated EUR
890 million, a decrease of 5% compared to 2011, mainly
due to decreased investments in Western Europe.
Consistent with 2011, the Company allocated a higher
proportion of its total marketing spend towards growth
geographies and strategic markets, priority areas for the
Company’s growth strategy. Accordingly, the Company
increased its marketing spend in key growth geographies