Philips 2012 Annual Report Download - page 194
Download and view the complete annual report
Please find page 194 of the 2012 Philips annual report below. You can navigate through the pages in the report by either clicking on the pages listed below, or by using the keyword search tool below to find specific information within the annual report.-
 1
1 -
2
-
3
-
4
-
5
-
6
-
7
-
8
-
9
-
10
-
11
-
12
-
13
-
14
-
15
-
16
-
17
-
18
-
19
-
20
-
21
-
22
-
23
-
24
-
25
-
26
-
27
-
28
-
29
-
30
-
31
-
32
-
33
-
34
-
35
-
36
-
37
-
38
-
39
-
40
-
41
-
42
-
43
-
44
-
45
-
46
-
47
-
48
-
49
-
50
-
51
-
52
-
53
-
54
-
55
-
56
-
57
-
58
-
59
-
60
-
61
-
62
-
63
-
64
-
65
-
66
-
67
-
68
-
69
-
70
-
71
-
72
-
73
-
74
-
75
-
76
-
77
-
78
-
79
-
80
-
81
-
82
-
83
-
84
-
85
-
86
-
87
-
88
-
89
-
90
-
91
-
92
-
93
-
94
-
95
-
96
-
97
-
98
-
99
-
100
-
101
-
102
-
103
-
104
-
105
-
106
-
107
-
108
-
109
-
110
-
111
-
112
-
113
-
114
-
115
-
116
-
117
-
118
-
119
-
120
-
121
-
122
-
123
-
124
-
125
-
126
-
127
-
128
-
129
-
130
-
131
-
132
-
133
-
134
-
135
-
136
-
137
-
138
-
139
-
140
-
141
-
142
-
143
-
144
-
145
-
146
-
147
-
148
-
149
-
150
-
151
-
152
-
153
-
154
-
155
-
156
-
157
-
158
-
159
-
160
-
161
-
162
-
163
-
164
-
165
-
166
-
167
-
168
-
169
-
170
-
171
-
172
-
173
-
174
-
175
-
176
-
177
-
178
-
179
-
180
-
181
-
182
-
183
-
 184
184 -
 185
185 -
 186
186 -
 187
187 -
 188
188 -
 189
189 -
 190
190 -
 191
191 -
 192
192 -
 193
193 -
 194
194 -
 195
195 -
 196
196 -
 197
197 -
 198
198 -
 199
199 -
 200
200 -
 201
201 -
 202
202 -
 203
203 -
 204
204 -
205
-
206
-
207
-
208
-
209
-
210
-
211
-
212
-
213
-
214
-
215
-
216
-
217
-
218
-
219
-
220
-
221
-
222
-
223
-
224
-
225
-
226
-
227
-
228
-
229
-
230
-
231
 |
 |

14 Sustainability statements 14.4 - 14.5
194 Annual Report 2012
Classification of the complaints investigated
2010 2011 2012
category substantiated unsubstantiated substantiated unsubstantiated substantiated unsubstantiated
Health & Safety 1 2 − 2 2 7
Treatment of employees 22 111 18 68 22 150
Legal 4 7 − 5 5 8
Business Integrity 39 45 33 43 37 51
Supply Management 2 2 2 1 1 −
Other 10 9 3 5 11 4
Total 78 176 56 124 78 220
14.5 Supplier indicators
Philips has a direct business relationship with approximately 10,000
product and component suppliers and 30,000 service providers. Given
the size and complexity of our supply chain we need to focus our
efforts. Therefore, we developed an approach based on the supplier’s
sustainability risk profile related to spend, country of production,
business risk and type of supplier relationship. 594 supplier sites have
been identified as risk suppliers, including 497 product and component
suppliers, and 97 service providers. Different types of service providers
are part of our audit program, including labor agencies and
transportation companies. All risk suppliers are by definition part of
our audit program.
Philips Supplier Sustainability Declaration
The Philips Supplier Sustainability Declaration is based on the EICC
code of conduct and we added requirements on Freedom of
Association and Collective Bargaining. The topics covered include labor
and human rights, worker health and safety, environmental impact,
ethics, and management systems. We monitor supplier compliance to
the Declaration through a system of regular audits.
In 2012 we updated the Philips Supplier Sustainability Declaration and
audit tools, to be in line with the new version of the EICC code of
conduct that was recently issued. The updated Declaration includes 4
entirely new provisions, and 14 updates to existing provisions. The new
provisions are related to responsible sourcing of minerals, protection
of privacy, non-retaliation, and supplier responsibility to monitor code
compliance at next tier suppliers. We begin to roll-out the updated
Philips Supplier Sustainability Declaration via the purchasing contracts
signed with suppliers, and via all trainings and audits conducted.
The Declaration requires suppliers to cascade the EICC Code of
Conduct down to their next tier suppliers. This roll-out to deeper tiers
in the supply chain is reviewed during the on-site audits. Risk suppliers
with who we have a direct business relationship are included in the
audit program, and most of these are tier 1 suppliers. However,
sometimes Philips also selects and prescribes the tier 2 suppliers, in
which case these tier 2 suppliers will also be included in the audit
program.
We monitor supplier compliance with the Declaration through a
system of regular audits. During these audits, an independent external
party visits the supplier’s site for several man-days to hold interviews
with workers and management, do a factory tour, and review
documentation. Based on purchasing spend, production country and
type of business, Philips selects suppliers for inclusion in the audit and
supplier development program. 594 suppliers have been identified as
risk suppliers and are included in the audit program; the majority of
these are in China. During the audits, compliance with all sections of
the Declaration is reviewed. In the event of non-compliance we require
suppliers to make a corrective action plan, and we monitor its
implementation until all major non-compliances are resolved. Full-
scope audits are conducted in a 3-year cycle; to date we have audited
90% of all identified risk suppliers.
2012 supplier sustainability audits
In 2012 we audited 159 of our current risk suppliers, including 100
continual conformance audits with suppliers that we already audited in
2009. Risk suppliers from recently acquired companies are also
included, and this year we audited 17 suppliers from the acquisitions of
Indal, Povos, and Preethi. As in previous years, the majority of the audits
were done in China. Also in Brazil and India audits were done, as well
as a small number of audits in Mexico, Indonesia, Philippines, Russia,
Belarus, Ukraine and the Dominican Republic. With these audits we
directly or indirectly impacted over 124,000 workers employed at the
production sites that were audited.
On top of the audits with current risk suppliers, we also audited 65
potential suppliers during the supplier selection process. Below we
report on the findings at existing suppliers only; findings at potential
suppliers are not included in this report since these suppliers are not
(yet) part of Philips’ supply base.
To track our progress in improving compliance with risk suppliers we
use the key performance indicator ‘compliance rate’, being the
percentage of the risk suppliers that was audited in the last 3 years, and
has resolved all major non compliances. During 2012 we achieved a
compliance rate of 75% (2011: 72%).
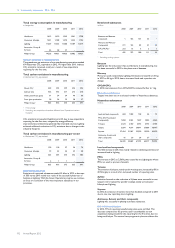
Number of initial and continual conformance audits
■-initial--■-re-audit
120
80
40
0
5
6
Brazil
37
73
China
8
13
India
8
9
Others
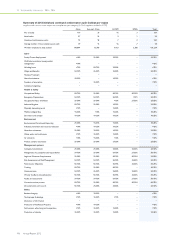
Audit findings
Below table shows the results of the full scope audits done during 2012.
On average we identified 18 major non-compliances per audit, 5 zero
tolerance and 13 limited tolerance non-compliances, and we work with
each supplier to resolve these non-compliances within 90 days where
possible. The limited-tolerance non-compliances include all
management systems related issues, accounting for an average of 8 non-
compliances per audit. The continual conformance audits showed on
average a better result than the initial audits with suppliers that went
through the audit cycle for the first time.
When the audit reveals areas of non-compliance we request suppliers
to implement corrective actions and we monitor the implementation
during resolution audits. During the year a total of 1,375 corrective
actions were implemented successfully by our suppliers to resolve
major non-compliances. The results of the resolution audits are not
shown in below table.
During 2012 for 2 supplier sites the phase-out decision was taken due
to, amongst others, a lack of sustainability improvements.
The most frequently observed areas of major non-compliance are:
• Working hours, wages and benefits: excessive overtime, continual
seven-day working weeks, insufficient record keeping of standard
and overtime working hours, no payment of overtime premiums