Philips 2012 Annual Report Download - page 50
Download and view the complete annual report
Please find page 50 of the 2012 Philips annual report below. You can navigate through the pages in the report by either clicking on the pages listed below, or by using the keyword search tool below to find specific information within the annual report.-
 1
1 -
2
-
3
-
4
-
5
-
6
-
7
-
8
-
9
-
10
-
11
-
12
-
13
-
14
-
15
-
16
-
17
-
18
-
19
-
20
-
21
-
22
-
23
-
24
-
25
-
26
-
27
-
28
-
29
-
30
-
31
-
32
-
33
-
34
-
35
-
36
-
37
-
38
-
39
-
 40
40 -
 41
41 -
 42
42 -
 43
43 -
 44
44 -
 45
45 -
 46
46 -
 47
47 -
 48
48 -
 49
49 -
 50
50 -
 51
51 -
 52
52 -
 53
53 -
 54
54 -
 55
55 -
 56
56 -
 57
57 -
 58
58 -
 59
59 -
 60
60 -
61
-
62
-
63
-
64
-
65
-
66
-
67
-
68
-
69
-
70
-
71
-
72
-
73
-
74
-
75
-
76
-
77
-
78
-
79
-
80
-
81
-
82
-
83
-
84
-
85
-
86
-
87
-
88
-
89
-
90
-
91
-
92
-
93
-
94
-
95
-
96
-
97
-
98
-
99
-
100
-
101
-
102
-
103
-
104
-
105
-
106
-
107
-
108
-
109
-
110
-
111
-
112
-
113
-
114
-
115
-
116
-
117
-
118
-
119
-
120
-
121
-
122
-
123
-
124
-
125
-
126
-
127
-
128
-
129
-
130
-
131
-
132
-
133
-
134
-
135
-
136
-
137
-
138
-
139
-
140
-
141
-
142
-
143
-
144
-
145
-
146
-
147
-
148
-
149
-
150
-
151
-
152
-
153
-
154
-
155
-
156
-
157
-
158
-
159
-
160
-
161
-
162
-
163
-
164
-
165
-
166
-
167
-
168
-
169
-
170
-
171
-
172
-
173
-
174
-
175
-
176
-
177
-
178
-
179
-
180
-
181
-
182
-
183
-
184
-
185
-
186
-
187
-
188
-
189
-
190
-
191
-
192
-
193
-
194
-
195
-
196
-
197
-
198
-
199
-
200
-
201
-
202
-
203
-
204
-
205
-
206
-
207
-
208
-
209
-
210
-
211
-
212
-
213
-
214
-
215
-
216
-
217
-
218
-
219
-
220
-
221
-
222
-
223
-
224
-
225
-
226
-
227
-
228
-
229
-
230
-
231
 |
 |

5 Group performance 5.2.3 - 5.2.4
50 Annual Report 2012
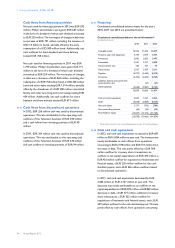
Employee turnover
in %
2011 2012
Female 13 14
Male 10 13
Philips Group 11 14
Exit diversity
in % ■-male--■-female
100
80
60
40
20
0
57
43
Staff
70
30
Professionals
82
18
Management
91
9
Executives
5.2.4 Employment
The total number of Philips Group employees was
118,087 at the end of 2012, compared to 121,888 at the
end of 2011. Approximately 42% were employed in the
Lighting sector, due to the continued vertical integration
in this business. Some 32% were employed in the
Healthcare sector and approximately 16% in the
Consumer Lifestyle sector.
Employees per sector 2012
in FTEs at year-end
Healthcare
37,460
Consumer Lifestyle
18,911
Lighting
50,224
Innovation, Group & Services
11,492
Compared to 2011, the number of employees in
continuing operations decreased by approximately 3,800.
This decrease reflects a reduction of 3,686 employees,
mainly related to the company’s overhead reduction
program, primarily at Lighting and IG&S. It also reflects
the departure of 1,024 employees, mainly due to the
industrial footprint reduction at Lighting, and the addition
of 909 employees from acquisitions (mainly Indal).
Approximately 52% of the Philips workforce is located in
mature geographies, and about 48% in growth
geographies. In 2012, the number of employees in mature
geographies decreased by 3,951, as the additional
headcount from acquisitions was more than offset by
reductions relating to the company’s overhead reduction
program and the industrial footprint reduction in Lighting.
Growth geographies headcount increased by 150,
primarily in the growth businesses in Consumer Lifestyle.
Employees per sector
in FTEs at year-end
2010 2011 2012
Healthcare 36,253 37,955 37,460
Consumer Lifestyle 14,095 18,291 18,911
Lighting 53,888 53,168 50,224
Innovation, Group & Services 11,929 12,474 11,492
Continuing operations 116,165 121,888 118,087
Discontinued operations 3,610 3,353 −
119,775 125,241 118,087
Employees per geographic cluster
in FTEs at year-end
2010 2011 2012
Western Europe 33,557 33,515 31,562
North America 27,881 28,249 26,122
Other mature geographies 3,045 3,234 3,363
Total mature geographies 64,483 64,998 61,047
Growth geographies 51,682 56,890 57,040
Continuing operations 116,165 121,888 118,087
Discontinued operations 3,610 3,353 −
119,775 125,241 118,087
Employment
in FTEs
2010 2011 2012
Position at beginning of year 116,153 119,775 125,241
Consolidation changes:
acquisitions 1,457 4,759 909
divestments (307) (479) (1,024)
comparable changes 3,626 1,443 (3,686)
Divestment and other changes
in discontinued operations (1,154) (257) (3,353)
Position at year-end 119,775 125,241 118,087
of which:
continuing operations 116,165 121,888 118,087
discontinued operations 3,610 3,353 −