Philips 2012 Annual Report Download - page 43
Download and view the complete annual report
Please find page 43 of the 2012 Philips annual report below. You can navigate through the pages in the report by either clicking on the pages listed below, or by using the keyword search tool below to find specific information within the annual report.-
 1
1 -
2
-
3
-
4
-
5
-
6
-
7
-
8
-
9
-
10
-
11
-
12
-
13
-
14
-
15
-
16
-
17
-
18
-
19
-
20
-
21
-
22
-
23
-
24
-
25
-
26
-
27
-
28
-
29
-
30
-
31
-
32
-
 33
33 -
 34
34 -
 35
35 -
 36
36 -
 37
37 -
 38
38 -
 39
39 -
 40
40 -
 41
41 -
 42
42 -
 43
43 -
 44
44 -
 45
45 -
 46
46 -
 47
47 -
 48
48 -
 49
49 -
 50
50 -
 51
51 -
 52
52 -
 53
53 -
54
-
55
-
56
-
57
-
58
-
59
-
60
-
61
-
62
-
63
-
64
-
65
-
66
-
67
-
68
-
69
-
70
-
71
-
72
-
73
-
74
-
75
-
76
-
77
-
78
-
79
-
80
-
81
-
82
-
83
-
84
-
85
-
86
-
87
-
88
-
89
-
90
-
91
-
92
-
93
-
94
-
95
-
96
-
97
-
98
-
99
-
100
-
101
-
102
-
103
-
104
-
105
-
106
-
107
-
108
-
109
-
110
-
111
-
112
-
113
-
114
-
115
-
116
-
117
-
118
-
119
-
120
-
121
-
122
-
123
-
124
-
125
-
126
-
127
-
128
-
129
-
130
-
131
-
132
-
133
-
134
-
135
-
136
-
137
-
138
-
139
-
140
-
141
-
142
-
143
-
144
-
145
-
146
-
147
-
148
-
149
-
150
-
151
-
152
-
153
-
154
-
155
-
156
-
157
-
158
-
159
-
160
-
161
-
162
-
163
-
164
-
165
-
166
-
167
-
168
-
169
-
170
-
171
-
172
-
173
-
174
-
175
-
176
-
177
-
178
-
179
-
180
-
181
-
182
-
183
-
184
-
185
-
186
-
187
-
188
-
189
-
190
-
191
-
192
-
193
-
194
-
195
-
196
-
197
-
198
-
199
-
200
-
201
-
202
-
203
-
204
-
205
-
206
-
207
-
208
-
209
-
210
-
211
-
212
-
213
-
214
-
215
-
216
-
217
-
218
-
219
-
220
-
221
-
222
-
223
-
224
-
225
-
226
-
227
-
228
-
229
-
230
-
231
 |
 |

5 Group performance 5.1.15 - 5.1.15
Annual Report 2012 43
Condensed consolidated statements of cash flows for the
years ended December 31, 2010, 2011 and 2012 are
presented below:
Condensed consolidated cash flow statements1)
in millions of euros
2010 2011 2012
Cash flows from operating activities:
Net income (loss) 1,448 (1,291) 231
Adjustments to reconcile net income
to net cash provided by operating
activities 626 2,059 1,967
Net cash provided by operating
activities 2,074 768 2,198
Net cash (used for) provided by
investing activities (597) (1,293) (912)
Cash flows before financing activities2) 1,477 (525) 1,286
Net cash used for financing activities (97) (1,790) (292)
Cash (used for) provided by continuing
operations 1,380 (2,315) 994
Net cash (used for) discontinued
operations (22) (364) (256)
Effect of changes in exchange rates on
cash and cash equivalents 89 (7) (51)
Total change in cash and cash
equivalents 1,447 (2,686) 687
Cash and cash equivalents at the
beginning of year 4,386 5,833 3,147
Cash and cash equivalents at the end of
year 5,833 3,147 3,834
1) Please refer to section 12.7, Consolidated statements of cash flows, of this
Annual Report
2) Please refer to chapter 15, Reconciliation of non-GAAP information, of this
Annual Report
Cash flows from investing activities
2012 cash flows from investing activities resulted in a net
outflow of EUR 912 million, attributable to EUR 475
million cash used for net capital expenditures, EUR 259
million used for acquisitions, as well as a EUR 167 million
outflow for financial assets, mainly due to loans provided
to TPV Technology Limited and the television joint
venture TP Vision Holding BV in connection with the
divestment of the Televison business (EUR 151 million in
aggregate).
2011 cash flows from investing activities resulted in a net
outflow of EUR 1,293 million, attributable to EUR 872
million cash used for net capital expenditures and EUR
509 million used for acquisitions, mainly for Povos, Preethi
and Sectra. This was partly offset by EUR 106 million
proceeds from sale of financial assets and divestment,
mainly TCL and Digimarc shares.
Net capital expenditures
Net capital expenditures totaled EUR 475 million, which
was EUR 397 million lower than 2011, mainly due to
proceeds received from the sale of the High Tech Campus
of EUR 425 million (consisting of a EUR 373 million cash
transaction and an amount of EUR 52 million that will be
received in future years) and the divestment of our 50%
ownership right in the Senseo trademark to Sara Lee for
EUR 170 million. Excluding these impacts, higher
investments were visible in all sectors, notably additional
growth-focused investments in Lighting.
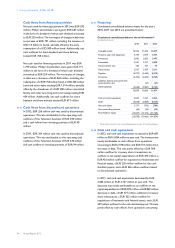
Cash flows from acquisitions and financial assets,
divestments and derivatives
in millions of euros
■-divestments and derivatives--■-acquisitions and financial assets
3,000
0
(3,000)
(6,000)
2,936
(5,331)
(2,395)
2008
764
(301)
463
2009
360
(241)
119
2010
131
(552)
(421)
2011
(11)
(426)
(437)
2012
Acquisitions and financial assets
The net cash impact of acquisitions of businesses and
financial assets in 2012 was a total of EUR 426 million,
mainly related to the acquisition of Indal. The EUR 167
million outflow for financial assets mainly relates to loans
provided to TPV Technology Limited and the television
joint venture TP Vision Holding BV in connection with the
divestment of the Television business (EUR 151 million in
aggregate).
The net cash impact of acquisitions of businesses and
financial assets in 2011 was a total of EUR 552 million,
mainly related to the acquisitions for Povos, Preethi and
Sectra.
Divestments and derivatives
Cash proceeds of EUR 36 million were received from
divestments, mainly of non-strategic businesses within
Consumer Lifestyle and Healthcare. Cash flows from
derivatives and securities led to a net cash outflow of EUR
47 million.
In 2011, cash proceeds of EUR 106 million were received
from divestments, including EUR 69 million from the sale
of remaining shares in TCL, as well as divestments of non-
strategic businesses within Consumer Lifestyle and
Healthcare. Cash flows from derivatives and securities led
to a net cash inflow of EUR 25 million.