Philips 2012 Annual Report Download - page 165
Download and view the complete annual report
Please find page 165 of the 2012 Philips annual report below. You can navigate through the pages in the report by either clicking on the pages listed below, or by using the keyword search tool below to find specific information within the annual report.-
 1
1 -
2
-
3
-
4
-
5
-
6
-
7
-
8
-
9
-
10
-
11
-
12
-
13
-
14
-
15
-
16
-
17
-
18
-
19
-
20
-
21
-
22
-
23
-
24
-
25
-
26
-
27
-
28
-
29
-
30
-
31
-
32
-
33
-
34
-
35
-
36
-
37
-
38
-
39
-
40
-
41
-
42
-
43
-
44
-
45
-
46
-
47
-
48
-
49
-
50
-
51
-
52
-
53
-
54
-
55
-
56
-
57
-
58
-
59
-
60
-
61
-
62
-
63
-
64
-
65
-
66
-
67
-
68
-
69
-
70
-
71
-
72
-
73
-
74
-
75
-
76
-
77
-
78
-
79
-
80
-
81
-
82
-
83
-
84
-
85
-
86
-
87
-
88
-
89
-
90
-
91
-
92
-
93
-
94
-
95
-
96
-
97
-
98
-
99
-
100
-
101
-
102
-
103
-
104
-
105
-
106
-
107
-
108
-
109
-
110
-
111
-
112
-
113
-
114
-
115
-
116
-
117
-
118
-
119
-
120
-
121
-
122
-
123
-
124
-
125
-
126
-
127
-
128
-
129
-
130
-
131
-
132
-
133
-
134
-
135
-
136
-
137
-
138
-
139
-
140
-
141
-
142
-
143
-
144
-
145
-
146
-
147
-
148
-
149
-
150
-
151
-
152
-
153
-
154
-
 155
155 -
 156
156 -
 157
157 -
 158
158 -
 159
159 -
 160
160 -
 161
161 -
 162
162 -
 163
163 -
 164
164 -
 165
165 -
 166
166 -
 167
167 -
 168
168 -
 169
169 -
 170
170 -
 171
171 -
 172
172 -
 173
173 -
 174
174 -
 175
175 -
176
-
177
-
178
-
179
-
180
-
181
-
182
-
183
-
184
-
185
-
186
-
187
-
188
-
189
-
190
-
191
-
192
-
193
-
194
-
195
-
196
-
197
-
198
-
199
-
200
-
201
-
202
-
203
-
204
-
205
-
206
-
207
-
208
-
209
-
210
-
211
-
212
-
213
-
214
-
215
-
216
-
217
-
218
-
219
-
220
-
221
-
222
-
223
-
224
-
225
-
226
-
227
-
228
-
229
-
230
-
231
 |
 |

12 Group financial statements 12.11 - 12.11
Annual Report 2012 165
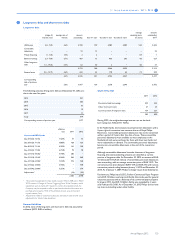
The weighted averages of the assumptions used to calculate the net
periodic pension cost for years ended December 31:
2011 2012
Netherlands other Netherlands other
Discount rate 4.7% 5.3% 3.9% 4.4%
Expected returns on
plan assets 5.3% 6.2% 5.4% 5.9%
Rate of
compensation
increase * 4.0% * 2.9%
* The rate of compensation increase for the Netherlands consists of a general
compensation increase and an individual salary increase based on merit, seniority
and promotion. The average individual salary increase for all active participants
for the remaining working lifetime is 0.75% annually. The assumed rate of general
compensation increase for the Netherlands for calculating the projected benefit
obligations amounts to 2.0% (2011: 2.0%). The indexation assumption used to
calculate the projected benefit obligations for the Netherlands is 1.0% (2011: 1.0%).
Sensitivity analysis
The table below illustrates the approximate impact on the defined-
benefit obligation if the Company were to change key assumptions by
one-percent point.
Impact on DBO
increase decrease
assumption 1% assumption 1%
2012
Discount rate (2,784) 3,039
2011
Discount rate (2,583) 3,159
Longevity also impacts postemployment benefit liabilities. The table
below illustrates the impact on the 2012 defined-benefit obligation and
expense of a 10% decrease in the assumed rates of mortality for the
Company’s major schemes. A 10% decrease in assumed mortality rates
equals improvement of life expectancy by 0.5 - 1 year.
Increase of current year:
DBO expense
663 28
Historical data
2008 2009 2010 2011 2012
Present value of defined-
benefit obligations 16,846 17,720 20,166 22,413 23,670
Fair value of plan assets 17,899 18,470 20,080 21,249 22,791
Surplus 1,053 750 (86) (1,164) (879)
Experience adjustments in
% on:
- defined-benefit
obligations (gain) loss 1.2% (0.9%) 0.8% (0.6%) (0.4%)
- fair value of plan assets
(gain) loss 10.9% (0.6%) (3.6%) (3.0%) (6.1%)
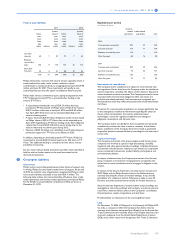
Defined-benefit plans: other postretirement benefits
In addition to providing pension benefits, the Company provides other
postretirement benefits, primarily retiree medical benefits, in certain
countries. The Company funds those other postretirement benefit
plans as claims are incurred.
Movements in the net liability for other defined-benefit obligations:
2011 2012
Defined-benefit obligation at the beginning of year 297 269
Service cost 1 1
Interest cost 17 12
Actuarial (gains) or losses (30) 1
Plan amendments − (25)
Curtailment gains − −
Changes in consolidation − −
Benefits paid (17) (17)
Exchange rate differences 1 (6)
Miscellaneous − 15
Defined-benefit obligation at end of year 269 250
Present value of funded obligations at end of year − −
Present value of unfunded obligations at end of year 269 250
Funded status (269) (250)
Unrecognized prior-service cost (17) (13)
Net balances (286) (263)
Classification of the net balance is as follows:
Provision for other postretirement benefits (286) (263)
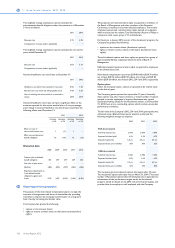
Other postretirement benefit expense recognized in the Consolidated
statements of income:
2010 2011 2012
Service cost 2 1 1
Interest cost on accumulated
postretirement benefits 20 17 12
Prior-service cost (2) (2) (27)
Curtailment loss (gain) (9) − −
Other − − −
11 16 (14)
Amounts recognized in the Consolidated statements of comprehensive
income:
2010 2011 2012
Actuarial (gains) losses (11) (30) 1
Total recognized in Total Comprehensive
Income − (14) (13)
The expense for other postretirement benefits is recognized in the
following line items in the Consolidated statements of income:
2010 2011 2012
Cost of sales (7) 2 1
Selling expenses 1 1 1
General and administrative expenses 17 13 (16)
11 16 (14)