Philips 2012 Annual Report Download - page 4
Download and view the complete annual report
Please find page 4 of the 2012 Philips annual report below. You can navigate through the pages in the report by either clicking on the pages listed below, or by using the keyword search tool below to find specific information within the annual report.-
 1
1 -
 2
2 -
 3
3 -
 4
4 -
 5
5 -
 6
6 -
 7
7 -
 8
8 -
 9
9 -
 10
10 -
 11
11 -
 12
12 -
 13
13 -
 14
14 -
 15
15 -
16
-
17
-
18
-
19
-
20
-
21
-
22
-
23
-
24
-
25
-
26
-
27
-
28
-
29
-
30
-
31
-
32
-
33
-
34
-
35
-
36
-
37
-
38
-
39
-
40
-
41
-
42
-
43
-
44
-
45
-
46
-
47
-
48
-
49
-
50
-
51
-
52
-
53
-
54
-
55
-
56
-
57
-
58
-
59
-
60
-
61
-
62
-
63
-
64
-
65
-
66
-
67
-
68
-
69
-
70
-
71
-
72
-
73
-
74
-
75
-
76
-
77
-
78
-
79
-
80
-
81
-
82
-
83
-
84
-
85
-
86
-
87
-
88
-
89
-
90
-
91
-
92
-
93
-
94
-
95
-
96
-
97
-
98
-
99
-
100
-
101
-
102
-
103
-
104
-
105
-
106
-
107
-
108
-
109
-
110
-
111
-
112
-
113
-
114
-
115
-
116
-
117
-
118
-
119
-
120
-
121
-
122
-
123
-
124
-
125
-
126
-
127
-
128
-
129
-
130
-
131
-
132
-
133
-
134
-
135
-
136
-
137
-
138
-
139
-
140
-
141
-
142
-
143
-
144
-
145
-
146
-
147
-
148
-
149
-
150
-
151
-
152
-
153
-
154
-
155
-
156
-
157
-
158
-
159
-
160
-
161
-
162
-
163
-
164
-
165
-
166
-
167
-
168
-
169
-
170
-
171
-
172
-
173
-
174
-
175
-
176
-
177
-
178
-
179
-
180
-
181
-
182
-
183
-
184
-
185
-
186
-
187
-
188
-
189
-
190
-
191
-
192
-
193
-
194
-
195
-
196
-
197
-
198
-
199
-
200
-
201
-
202
-
203
-
204
-
205
-
206
-
207
-
208
-
209
-
210
-
211
-
212
-
213
-
214
-
215
-
216
-
217
-
218
-
219
-
220
-
221
-
222
-
223
-
224
-
225
-
226
-
227
-
228
-
229
-
230
-
231
 |
 |

Performance highlights
4 Annual Report 2012
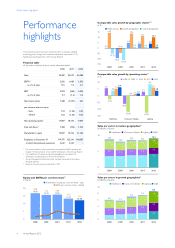
Performance
highlights
Prior periods amounts have been revised to reflect a voluntary adopted
accounting policy change, and immaterial adjustments (see section 12.10,
Significant accounting policies, of this Annual Report)
Financial table
all amounts in millions of euros unless otherwise stated
2010 2011 2012
Sales 22,287 22,579 24,788
EBITA1) 2,556 1,680 1,502
as a % of sales 11.5 7.4 6.1
EBIT 2,074 (269) 1,030
as a % of sales 9.3 (1.2) 4.2
Net income (loss) 1,448 (1,291) 231
per common share in euros:
- basic 1.54 (1.36) 0.25
- diluted 1.53 (1.36) 0.25
Net operating capital1) 11,897 10,372 9,307
Free cash flows1) 1,358 (104) 1,723
Shareholders’ equity 15,007 12,316 11,140
Employees at December 31 119,775 125,241 118,087
of which discontinued operations 3,610 3,353 −
1) For a reconciliation to the most directly comparable GAAP measures, see
chapter 15, Reconciliation of non-GAAP information, of this Annual Report
2) For a definition of mature and growth geographies, see chapter 18,
Definitions and abbreviations, of this Annual Report
3) Group Management & Services sector has been renamed to Innovation,
Group & Services
4) Based on 60 pulse surveys conducted in 2012
Equity and EBITA per common share1)
in euros ■-shareholders’ equity per common share - basic
--EBITA per common share - diluted
20
15
10
5
0
0.98
16.80
2008
1.18
15.70
2009
2.69
15.86
2010
1.76
13.30
2011
1.62
12.18
2012
Comparable sales growth by geographic cluster1,2)
in %
■-Philips Group--■-growth geographies--■-mature geographies
15
10
5
0
(5)
(10)
(15)
0.2
14.2
(5.1)
2008
(9.2)
(4.4)
(11.0)
2009
4.8
13.6
1.2
2010
4.1
11.1
1.0
2011
4.1
10.1
1.2
2012
Comparable sales growth by operating sector1)
in % ■-2008_■-2009_■-2010_■-2011_■-2012
10
5
0
(5)
(10)
(15)
5.6
(2.7)
3.9 5.3 6.4
Healthcare
(6.0)
(12.0)
0.4 1.1 1.7
Consumer Lifestyle
3.1
(12.6)
8.7
6.1
3.8
Lighting
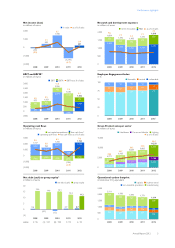
Sales per sector in mature geographies2)
in billions of euros
■-Healthcare_■-Consumer Lifestyle_■-Lighting_■-IG&S3)
18
9
0
2008
6.4
3.8
5.0
0.5
15.7
2009
6.4
3.3
4.3
0.4
14.4
2010
6.9
3.4
4.7
0.4
15.3
2011
6.9
3.3
4.6
0.3
15.1
2012
7.6
3.3
5.0
0.3
16.2
Sales per sector in growth geographies2)
in billions of euros
■-Healthcare_■-Consumer Lifestyle _■-Lighting_■-IG&S
10
8
6
4
2
0
2008
1.3
2.1
2.4
0.2
6.0
2009
1.5
1.8
2.2
0.2
5.7
2010
1.7
2.1
2.9
0.3
7.0
2011
1.9
2.4
3.1
0.1
7.5
2012
2.4
2.7
3.4
0.1
8.6