Philips 2012 Annual Report Download - page 123
Download and view the complete annual report
Please find page 123 of the 2012 Philips annual report below. You can navigate through the pages in the report by either clicking on the pages listed below, or by using the keyword search tool below to find specific information within the annual report.-
 1
1 -
2
-
3
-
4
-
5
-
6
-
7
-
8
-
9
-
10
-
11
-
12
-
13
-
14
-
15
-
16
-
17
-
18
-
19
-
20
-
21
-
22
-
23
-
24
-
25
-
26
-
27
-
28
-
29
-
30
-
31
-
32
-
33
-
34
-
35
-
36
-
37
-
38
-
39
-
40
-
41
-
42
-
43
-
44
-
45
-
46
-
47
-
48
-
49
-
50
-
51
-
52
-
53
-
54
-
55
-
56
-
57
-
58
-
59
-
60
-
61
-
62
-
63
-
64
-
65
-
66
-
67
-
68
-
69
-
70
-
71
-
72
-
73
-
74
-
75
-
76
-
77
-
78
-
79
-
80
-
81
-
82
-
83
-
84
-
85
-
86
-
87
-
88
-
89
-
90
-
91
-
92
-
93
-
94
-
95
-
96
-
97
-
98
-
99
-
100
-
101
-
102
-
103
-
104
-
105
-
106
-
107
-
108
-
109
-
110
-
111
-
112
-
 113
113 -
 114
114 -
 115
115 -
 116
116 -
 117
117 -
 118
118 -
 119
119 -
 120
120 -
 121
121 -
 122
122 -
 123
123 -
 124
124 -
 125
125 -
 126
126 -
 127
127 -
 128
128 -
 129
129 -
 130
130 -
 131
131 -
 132
132 -
 133
133 -
134
-
135
-
136
-
137
-
138
-
139
-
140
-
141
-
142
-
143
-
144
-
145
-
146
-
147
-
148
-
149
-
150
-
151
-
152
-
153
-
154
-
155
-
156
-
157
-
158
-
159
-
160
-
161
-
162
-
163
-
164
-
165
-
166
-
167
-
168
-
169
-
170
-
171
-
172
-
173
-
174
-
175
-
176
-
177
-
178
-
179
-
180
-
181
-
182
-
183
-
184
-
185
-
186
-
187
-
188
-
189
-
190
-
191
-
192
-
193
-
194
-
195
-
196
-
197
-
198
-
199
-
200
-
201
-
202
-
203
-
204
-
205
-
206
-
207
-
208
-
209
-
210
-
211
-
212
-
213
-
214
-
215
-
216
-
217
-
218
-
219
-
220
-
221
-
222
-
223
-
224
-
225
-
226
-
227
-
228
-
229
-
230
-
231
 |
 |
12 Group financial statements 12.6 - 12.6
Annual Report 2012 123
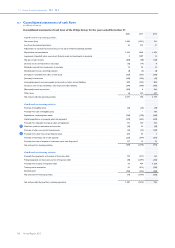
Equity and liabilities
2011 2012
Equity
Shareholders’ equity:
18
Preference shares, par value EUR 0.20 per share:
- Authorized: 2,000,000,000 shares (2011: 2,000,000,000 shares), issued none
Common shares, par value EUR 0.20 per share:
- Authorized: 2,000,000,000 shares (2011: 2,000,000,000 shares)
- Issued and fully paid: 957,132,962 shares (2011: 1,008,975,445 shares) 202 191
Capital in excess of par value 813 1,304
Retained earnings 12,878 10,713
Revaluation reserve 70 54
Other reserves 43 (19)
Treasury shares, at cost 42,541,687 shares (2011: 82,880,543 shares) (1,690) (1,103)
12,316 11,140
Non-controlling interests
18 34 34
Group equity 12,350 11,174
Non-current liabilities
Long-term debt
19 24 3,278 3,725
Long-term provisions
20 25 29 1,907 2,132
Deferred tax liabilities
3 77 92
Other non-current liabilities
21 1,999 2,001
Total non-current liabilities 7,261 7,950
Current liabilities
Short-term debt
19 24 582 809
Derivative financial liabilities
33 744 517
Income tax payable
3 191 200
Accounts and notes payable:
24 31
- Trade creditors 3,340 2,835
- Accounts payable to related parties 6 4
3,346 2,839
Accrued liabilities
22 3,026 3,171
Short-term provisions
20 25 29 787 837
Liabilities directly associated with assets held for sale
5 61 27
Other current liabilities
23 1,047 1,555
Total current liabilities 9,784 9,955
Contractual obligations and contingent liabilities
24 25
29,395 29,079
Prior periods amounts have been revised to reflect immaterial adjustments (see section 12.10, Significant accounting policies, of this Annual Report). The accompanying notes are
an integral part of these consolidated financial statements.