Philips 2012 Annual Report Download - page 212
Download and view the complete annual report
Please find page 212 of the 2012 Philips annual report below. You can navigate through the pages in the report by either clicking on the pages listed below, or by using the keyword search tool below to find specific information within the annual report.-
 1
1 -
2
-
3
-
4
-
5
-
6
-
7
-
8
-
9
-
10
-
11
-
12
-
13
-
14
-
15
-
16
-
17
-
18
-
19
-
20
-
21
-
22
-
23
-
24
-
25
-
26
-
27
-
28
-
29
-
30
-
31
-
32
-
33
-
34
-
35
-
36
-
37
-
38
-
39
-
40
-
41
-
42
-
43
-
44
-
45
-
46
-
47
-
48
-
49
-
50
-
51
-
52
-
53
-
54
-
55
-
56
-
57
-
58
-
59
-
60
-
61
-
62
-
63
-
64
-
65
-
66
-
67
-
68
-
69
-
70
-
71
-
72
-
73
-
74
-
75
-
76
-
77
-
78
-
79
-
80
-
81
-
82
-
83
-
84
-
85
-
86
-
87
-
88
-
89
-
90
-
91
-
92
-
93
-
94
-
95
-
96
-
97
-
98
-
99
-
100
-
101
-
102
-
103
-
104
-
105
-
106
-
107
-
108
-
109
-
110
-
111
-
112
-
113
-
114
-
115
-
116
-
117
-
118
-
119
-
120
-
121
-
122
-
123
-
124
-
125
-
126
-
127
-
128
-
129
-
130
-
131
-
132
-
133
-
134
-
135
-
136
-
137
-
138
-
139
-
140
-
141
-
142
-
143
-
144
-
145
-
146
-
147
-
148
-
149
-
150
-
151
-
152
-
153
-
154
-
155
-
156
-
157
-
158
-
159
-
160
-
161
-
162
-
163
-
164
-
165
-
166
-
167
-
168
-
169
-
170
-
171
-
172
-
173
-
174
-
175
-
176
-
177
-
178
-
179
-
180
-
181
-
182
-
183
-
184
-
185
-
186
-
187
-
188
-
189
-
190
-
191
-
192
-
193
-
194
-
195
-
196
-
197
-
198
-
199
-
200
-
201
-
 202
202 -
 203
203 -
 204
204 -
 205
205 -
 206
206 -
 207
207 -
 208
208 -
 209
209 -
 210
210 -
 211
211 -
 212
212 -
 213
213 -
 214
214 -
 215
215 -
 216
216 -
 217
217 -
 218
218 -
 219
219 -
 220
220 -
 221
221 -
 222
222 -
223
-
224
-
225
-
226
-
227
-
228
-
229
-
230
-
231
 |
 |

16 Five-year overview 16 - 16
212 Annual Report 2012
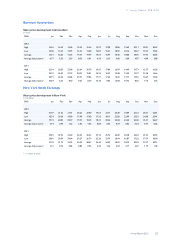
16 Five-year overview
all amounts in millions of euros unless otherwise stated
Prior periods amounts have been revised to reflect certain immaterial adjustments (see section 12.10, Significant accounting
policies, of this Annual Report).
Due to factors such as acquisitions and divestments, the amounts, percentages and ratios are not directly comparable.
General data
2008 2009 2010 2011 2012
Sales 21,682 20,092 22,287 22,579 24,788
% increase over previous year 4 (7) 11 1 10
Income from operations (EBIT) (loss) 287 667 2,074 (269) 1,030
Financial income and expenses - net 87 (162) (121) (240) (246)
Income (loss) from continuing operations 99 482 1,474 (776) 262
Income (loss) from discontinued operations (198) (52) (26) (515) (31)
Net income (loss) (99) 430 1,448 (1,291) 231
Free cash flow 1,117 764 1,358 (104) 1,723
Net assets 15,552 14,610 15,053 12,350 11,174
Turnover rate of net operating capital 1.41 1.56 1.68 1.96 2.35
Total employees at year-end (in thousands) 122 116 120 125 118
1) In euros unless otherwise stated
2) In millions of shares
3) Adjusted to make previous years comparable for the bonus shares (889 thousand) issued in May 2012
4) In manufacturing excluding new acquisitions
Income
2008 2009 2010 2011 2012
EBIT 287 667 2,074 (269) 1,030
as a % of sales 1.3 3.3 9.3 (1.2) 4.2
EBITA 977 1,103 2,556 1,680 1,502
as a % of sales 4.5 5.5 11.5 7.4 6.1
Income taxes (294) (100) (497) (283) (308)
as a % of income before taxes (78.6) (19.8) (25.4) 55.6 (39.3)
Income (loss) from continuing operations 99 482 1,474 (776) 262
as a % of shareholders’ equity (ROE) 0.5 3.4 9.8 (5.8) 2.2
Net income (loss) (99) 430 1,448 (1,291) 231