Philips 2012 Annual Report Download - page 137
Download and view the complete annual report
Please find page 137 of the 2012 Philips annual report below. You can navigate through the pages in the report by either clicking on the pages listed below, or by using the keyword search tool below to find specific information within the annual report.-
 1
1 -
2
-
3
-
4
-
5
-
6
-
7
-
8
-
9
-
10
-
11
-
12
-
13
-
14
-
15
-
16
-
17
-
18
-
19
-
20
-
21
-
22
-
23
-
24
-
25
-
26
-
27
-
28
-
29
-
30
-
31
-
32
-
33
-
34
-
35
-
36
-
37
-
38
-
39
-
40
-
41
-
42
-
43
-
44
-
45
-
46
-
47
-
48
-
49
-
50
-
51
-
52
-
53
-
54
-
55
-
56
-
57
-
58
-
59
-
60
-
61
-
62
-
63
-
64
-
65
-
66
-
67
-
68
-
69
-
70
-
71
-
72
-
73
-
74
-
75
-
76
-
77
-
78
-
79
-
80
-
81
-
82
-
83
-
84
-
85
-
86
-
87
-
88
-
89
-
90
-
91
-
92
-
93
-
94
-
95
-
96
-
97
-
98
-
99
-
100
-
101
-
102
-
103
-
104
-
105
-
106
-
107
-
108
-
109
-
110
-
111
-
112
-
113
-
114
-
115
-
116
-
117
-
118
-
119
-
120
-
121
-
122
-
123
-
124
-
125
-
126
-
 127
127 -
 128
128 -
 129
129 -
 130
130 -
 131
131 -
 132
132 -
 133
133 -
 134
134 -
 135
135 -
 136
136 -
 137
137 -
 138
138 -
 139
139 -
 140
140 -
 141
141 -
 142
142 -
 143
143 -
 144
144 -
 145
145 -
 146
146 -
 147
147 -
148
-
149
-
150
-
151
-
152
-
153
-
154
-
155
-
156
-
157
-
158
-
159
-
160
-
161
-
162
-
163
-
164
-
165
-
166
-
167
-
168
-
169
-
170
-
171
-
172
-
173
-
174
-
175
-
176
-
177
-
178
-
179
-
180
-
181
-
182
-
183
-
184
-
185
-
186
-
187
-
188
-
189
-
190
-
191
-
192
-
193
-
194
-
195
-
196
-
197
-
198
-
199
-
200
-
201
-
202
-
203
-
204
-
205
-
206
-
207
-
208
-
209
-
210
-
211
-
212
-
213
-
214
-
215
-
216
-
217
-
218
-
219
-
220
-
221
-
222
-
223
-
224
-
225
-
226
-
227
-
228
-
229
-
230
-
231
 |
 |

12 Group financial statements 12.10 - 12.10
Annual Report 2012 137
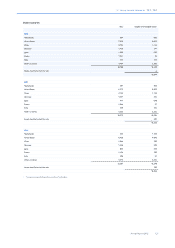
2010 2011
Sales in sector information (section 12.9)
Consumer Lifestyle (270) (208)
IG&S 270 208
Income from operations in sector
information (section 12.9)
Consumer Lifestyle (230) (175)
IG&S 230 175
Total assets in sector information
(section 12.9)
Consumer Lifestyle (56) (42)
IG&S 56 42
Other
The following amendments to standards have not been adopted by the
Company in 2012 as they are not applicable to the Company’s
Consolidated Financial Statements:
• IFRS 1 First-time Adoption of IFRSs - Severe Hyperinflation and Removal
of Fixed Dates for First-time Adopters;
• IAS 12 Income Taxes - Deferred Tax: Recovery of Underlying Assets.
Changes in accounting estimate
Pension liability discount rate
The Company uses interest rate curves to discount pension liabilities
as part of the accounting for retirement benefits under IAS 19 Employee
Benefits. These discount rates are also used for the calculation of
pension cost.
Until 2011 the Company has been using interest rate curves as compiled
and provided by Bloomberg. Some of these curves, used for the main
defined-benefit plans, are no longer available or are no longer fit for
continued use. Therefore the Company has decided to select Towers
Watson RATE:Link as new source for interest rate curves as the basis
for discounting of pension liabilities and calculation of pension cost. It
is the assessment of the Company that the RATE:Link curves provide
a better estimate of the discount rates. This change has an impact on
the balance sheet position for pension plans and the level of pension
cost in Income from Operations in the future. However, as the
Bloomberg rates are no longer available or fit for use it is not possible to
provide an assessment for the impact of this change in accounting
estimate as of the defined obigation measurement date of December
31, 2012.
Fair value of derivative financial instruments
The Company uses valuation techniques in order to determine the fair
value of derivative financial instruments. During 2012 we revisited the
approach of including the basis spread in our calculation of the fair value
of derivative instruments to better reflect the contract terms under the
current market conditions. As a result of this change in estimate a gain
of EUR 46 million was recognised in Financial income and expenses.
Reclassifications and adjustments
Certain items previously reported under specific financial statement
captions have been reclassified or adjusted to conform to the current
year reporting:
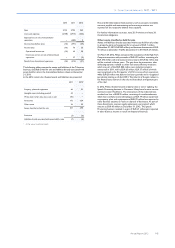
• Prior period amounts have been revised to adjust for warranty
provisions in Lighting related to prior years. These adjustments are
not material to the financial statements in any of the prior years. The
table below outlines the impact of these adjustments:
2010 2011
Statements of income
Income from operations (6) 0
Income taxes 2 0
Net income (loss) (4) 0
December 31,
2010
December 31,
2011
Balance sheets
Long-term provisions 27 27
Short-term provisions 28 28
Deferred tax assets 16 16
Shareholders’ equity (39) (39)
• Following a detailed analysis of software development activities, as
from 2012 certain software development cost are capitalized under
the product development category rather than under the software
category. This leads to the following reclassifications:
December 31,
2010
December 31,
2011
Note 10 – Intangible assets
excluding goodwill
Column Product development 104 129
Column Software (104) (129)
2010 2011
Statements of cash flows
Investing: Purchase of intantible assets 27 47
Investing: Expenditures on
development assets (27) (47)
• Up to 2011 the Company offset certain payables to customers at the
Lighting and Consumer Lifestyle sectors with the receivables from
the same customers (netting). In order to reflect appropriate
netting, as from 2012 payables to customers that cannot be offset
due to accounting rules are recognized as Other current liabilities,
with comparative figures being adjusted to follow the same
approach. This also has an impact on the statements of cash flows,
resulting in the following reclassifications:
December 31,
2010
December 31,
2011
Balance sheets
Receivables 426 412
Other current liabilities (426) (412)
2010 2011
Statements of cash flows
Operating: Increase in receivables and
other current assets (84) (26)
Operating: Increase (decrease) in
accounts payable, accrued and other
liabilities 84 26
• In 2012 it was noted that intercompany profit elimination on
property, plant and equipment was accidentally recognized on a net
basis as part of the Translation differences in the property, plant and
equipment carrying amount, rather than on a gross basis in Cost and
Accumulated depreciation. With regard to the same business, the
presentation of finance lease cash inflows should be appropriately
presented in the Operating and Financing category rather than in the