Philips 2012 Annual Report Download - page 167
Download and view the complete annual report
Please find page 167 of the 2012 Philips annual report below. You can navigate through the pages in the report by either clicking on the pages listed below, or by using the keyword search tool below to find specific information within the annual report.-
 1
1 -
2
-
3
-
4
-
5
-
6
-
7
-
8
-
9
-
10
-
11
-
12
-
13
-
14
-
15
-
16
-
17
-
18
-
19
-
20
-
21
-
22
-
23
-
24
-
25
-
26
-
27
-
28
-
29
-
30
-
31
-
32
-
33
-
34
-
35
-
36
-
37
-
38
-
39
-
40
-
41
-
42
-
43
-
44
-
45
-
46
-
47
-
48
-
49
-
50
-
51
-
52
-
53
-
54
-
55
-
56
-
57
-
58
-
59
-
60
-
61
-
62
-
63
-
64
-
65
-
66
-
67
-
68
-
69
-
70
-
71
-
72
-
73
-
74
-
75
-
76
-
77
-
78
-
79
-
80
-
81
-
82
-
83
-
84
-
85
-
86
-
87
-
88
-
89
-
90
-
91
-
92
-
93
-
94
-
95
-
96
-
97
-
98
-
99
-
100
-
101
-
102
-
103
-
104
-
105
-
106
-
107
-
108
-
109
-
110
-
111
-
112
-
113
-
114
-
115
-
116
-
117
-
118
-
119
-
120
-
121
-
122
-
123
-
124
-
125
-
126
-
127
-
128
-
129
-
130
-
131
-
132
-
133
-
134
-
135
-
136
-
137
-
138
-
139
-
140
-
141
-
142
-
143
-
144
-
145
-
146
-
147
-
148
-
149
-
150
-
151
-
152
-
153
-
154
-
155
-
156
-
 157
157 -
 158
158 -
 159
159 -
 160
160 -
 161
161 -
 162
162 -
 163
163 -
 164
164 -
 165
165 -
 166
166 -
 167
167 -
 168
168 -
 169
169 -
 170
170 -
 171
171 -
 172
172 -
 173
173 -
 174
174 -
 175
175 -
 176
176 -
 177
177 -
178
-
179
-
180
-
181
-
182
-
183
-
184
-
185
-
186
-
187
-
188
-
189
-
190
-
191
-
192
-
193
-
194
-
195
-
196
-
197
-
198
-
199
-
200
-
201
-
202
-
203
-
204
-
205
-
206
-
207
-
208
-
209
-
210
-
211
-
212
-
213
-
214
-
215
-
216
-
217
-
218
-
219
-
220
-
221
-
222
-
223
-
224
-
225
-
226
-
227
-
228
-
229
-
230
-
231
 |
 |

12 Group financial statements 12.11 - 12.11
Annual Report 2012 167
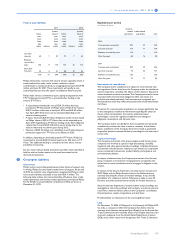
The fair value of the Company’s Accelerate! option was estimated using
a Black-Scholes option valuation model and the following assumptions:
2012
EUR-denominated
Risk-free interest rate 1,52%
Expected dividend yield 4.3%
Expected option life 6.5 yrs
Expected share price volatility 32%
USD-denominated
Risk-free interest rate 1.19%
Expected dividend yield 4.0%
Expected option life 6.5 yrs
Expected share price volatility 38%
The assumptions were used for these calculations only and do not
necessarily represent an indication of Management’s expectations of
future developments.
The Black-Scholes option valuation model was developed for use in
estimating the fair value of traded options which have no vesting
restrictions and are fully transferable. In addition, option valuation
models require the input of subjective assumptions, including the
expected price volatility.
The Company has based its volatility assumptions on historical
experience for a period equal to the expected life of the options. The
expected life of the options is also based upon historical experience.
The Company’s employee stock options have characteristics
significantly different from those of traded options, and changes in the
assumptions can materially affect the fair value estimate.
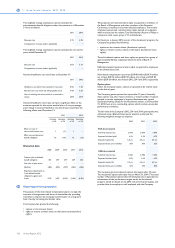
The following tables summarize information about the Company’s
options as of December 31, 2012 and changes during the year:
Option plans (excluding Accelerate! options)
EUR-denominated
shares
weighted average
exercise price
Outstanding at January 1, 2012 25,552,128 23.77
Granted 3,983,925 14.89
Exercised 754,979 13.76
Forfeited 2,263,287 22.92
Expired 3,408,522 32.02
Outstanding at December 31, 2012 23,109,265 21.43
Exercisable at December 31, 2012 13,019,540 22.89
The exercise prices range from EUR 12.63 to EUR 32.04. The weighted
average remaining contractual term for options outstanding and
options exercisable at December 31, 2012, was 5.9 years and 3.9 years,
respectively. The aggregate intrinsic value of the options outstanding
and options exercisable at December 31, 2012, was EUR 38 million and
EUR 18 million, respectively.
The weighted average grant-date fair value of options granted during
2012, 2011, and 2010 was EUR 2.84, EUR 4.82 and EUR 4.95,
respectively. The total intrinsic value of options exercised during 2012,
2011, and 2010 was approximately EUR 3 million, EUR 1 million and
EUR 6 million, respectively.
Option plans (excluding Accelerate! options)
USD-denominated
shares
weighted average
exercise price
Outstanding at January 1, 2012 17,110,352 30.56
Granted 3,280,941 19.60
Exercised 651,330 17.42
Forfeited 1,441,659 29.68
Expired 1,691,652 30.10
Outstanding at December 31, 2012 16,606,652 29.04
Exercisable at December 31, 2012 9,420,431 31.25
The exercise prices range from USD 16.41 to USD 44.15. The weighted
average remaining contractual term for options outstanding and
options exercisable at December 31, 2012, was 6.1 years and 4.2 years,
respectively. The aggregate intrinsic value of the options outstanding
and options exercisable at December 31, 2012, was USD 41 million and
USD 19 million, respectively.
The weighted average grant-date fair value of options granted during
2012, 2011 and 2010 was USD 4.56, USD 7.47 and USD 7.71,
respectively. The total intrinsic value of options exercised during 2012,
2011 and 2010 was USD 4 million, USD 4 million and USD 7 million.
At December 31, 2012, a total of EUR 28 million of unrecognized
compensation costs relate to non-vested options. These costs are
expected to be recognized over a weighted-average period of 1.7 years.
Cash received from exercises under the Company’s option plans
amounted to EUR 19 million, EUR 20 million and EUR 39 million in
2012, 2011, and 2010, respectively. The actual tax deductions realized
as a result of option exercises totaled approximately EUR 1 million,
EUR 1 million and EUR 2 million, in 2012, 2011, and 2010, respectively.
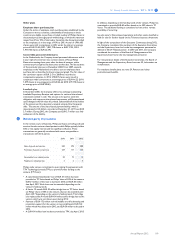
The outstanding options are categorized in exercise price ranges as
follows:
Option plans (excluding Accelerate! options)
exercise price shares
intrinsic value in
millions
weighted average
remaining
contractual term
EUR-
denominated
10-15 5,894,502 34 8.2 yrs
15-20 2,378,247 4 2.3 yrs
20-25 10,054,042 − 6.3 yrs
25-30 2,009,241 − 3.3 yrs
30-35 2,773,233 − 4.3 yrs
23,109,265 38 5.9 yrs
USD-
denominated
15-20 4,656,080 38 7.7 yrs
20-25 396,606 2 8.6 yrs
25-30 4,073,352 1 5.7 yrs
30-35 3,527,301 − 5.5 yrs
35-40 2,014,092 − 5.2 yrs
40-55 1,939,221 − 4.3 yrs
16,606,652 41 6.1 yrs
The aggregate intrinsic value in the tables and text above represents
the total pre-tax intrinsic value (the difference between the Company’s
closing share price on the last trading day of 2012 and the exercise