Philips 2012 Annual Report Download - page 208
Download and view the complete annual report
Please find page 208 of the 2012 Philips annual report below. You can navigate through the pages in the report by either clicking on the pages listed below, or by using the keyword search tool below to find specific information within the annual report.-
 1
1 -
2
-
3
-
4
-
5
-
6
-
7
-
8
-
9
-
10
-
11
-
12
-
13
-
14
-
15
-
16
-
17
-
18
-
19
-
20
-
21
-
22
-
23
-
24
-
25
-
26
-
27
-
28
-
29
-
30
-
31
-
32
-
33
-
34
-
35
-
36
-
37
-
38
-
39
-
40
-
41
-
42
-
43
-
44
-
45
-
46
-
47
-
48
-
49
-
50
-
51
-
52
-
53
-
54
-
55
-
56
-
57
-
58
-
59
-
60
-
61
-
62
-
63
-
64
-
65
-
66
-
67
-
68
-
69
-
70
-
71
-
72
-
73
-
74
-
75
-
76
-
77
-
78
-
79
-
80
-
81
-
82
-
83
-
84
-
85
-
86
-
87
-
88
-
89
-
90
-
91
-
92
-
93
-
94
-
95
-
96
-
97
-
98
-
99
-
100
-
101
-
102
-
103
-
104
-
105
-
106
-
107
-
108
-
109
-
110
-
111
-
112
-
113
-
114
-
115
-
116
-
117
-
118
-
119
-
120
-
121
-
122
-
123
-
124
-
125
-
126
-
127
-
128
-
129
-
130
-
131
-
132
-
133
-
134
-
135
-
136
-
137
-
138
-
139
-
140
-
141
-
142
-
143
-
144
-
145
-
146
-
147
-
148
-
149
-
150
-
151
-
152
-
153
-
154
-
155
-
156
-
157
-
158
-
159
-
160
-
161
-
162
-
163
-
164
-
165
-
166
-
167
-
168
-
169
-
170
-
171
-
172
-
173
-
174
-
175
-
176
-
177
-
178
-
179
-
180
-
181
-
182
-
183
-
184
-
185
-
186
-
187
-
188
-
189
-
190
-
191
-
192
-
193
-
194
-
195
-
196
-
197
-
 198
198 -
 199
199 -
 200
200 -
 201
201 -
 202
202 -
 203
203 -
 204
204 -
 205
205 -
 206
206 -
 207
207 -
 208
208 -
 209
209 -
 210
210 -
 211
211 -
 212
212 -
 213
213 -
 214
214 -
 215
215 -
 216
216 -
 217
217 -
 218
218 -
219
-
220
-
221
-
222
-
223
-
224
-
225
-
226
-
227
-
228
-
229
-
230
-
231
 |
 |

15 Reconciliation of non-GAAP information 15 - 15
208 Annual Report 2012
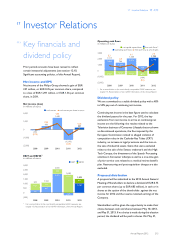
Sales growth composition per sector
in %
comparable growth currency effects consolidation changes nominal growth
2012 versus 2011
Healthcare 6.4 6.4 − 12.8
Consumer Lifestyle 1.7 3.8 0.5 6.0
Lighting 3.8 4.6 2.1 10.5
Innovation, Group & Services (7.4) 0.1 (6.2) (13.5)
Philips Group 4.1 5.0 0.7 9.8
2011 versus 2010
Healthcare 5.3 (2.5) 0.1 2.9
Consumer Lifestyle 1.1 (1.8) 2.7 2.0
Lighting 6.1 (2.3) (2.7) 1.1
Innovation, Group & Services (10.7) (0.1) (14.0) (24.8)
Philips Group 4.1 (2.2) (0.6) 1.3
2010 versus 2009
Healthcare 3.9 6.0 (0.2) 9.7
Consumer Lifestyle 0.4 4.9 1.5 6.8
Lighting 8.7 6.0 0.7 15.4
Innovation, Group & Services 13.9 2.0 (1.6) 14.2
Philips Group 4.8 5.6 0.5 10.9
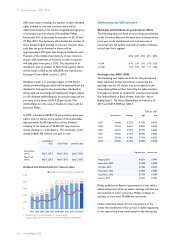
Sales growth composition per geographic cluster
in %
comparable growth currency effects consolidation changes nominal growth
2012 versus 2011
Western Europe (2.9) 1.1 1.9 0.1
North America 2.0 8.8 (0.8) 10.0
Other mature geographies 11.5 9.2 (0.1) 20.6
Total mature geographies 1.2 5.4 0.4 7.0
Growth geographies 10.1 4.2 1.1 15.4
Philips Group 4.1 5.0 0.7 9.8
2011 versus 2010
Western Europe (2.6) 0.3 (1.7) (4.0)
North America 2.9 (4.7) 0.3 (1.5)
Other mature geographies 7.0 2.7 (2.0) 7.7
Total mature geographies 1.0 (1.8) (0.8) (1.6)
Growth geographies 11.1 (3.2) (0.2) 7.7
Philips Group 4.1 (2.2) (0.6) 1.3
2010 versus 2009
Western Europe (1.5) 1.2 0.7 0.4
North America 1.5 5.8 − 7.3
Other mature geographies 12.6 14.5 3.2 30.3
Total mature geographies 1.2 4.3 0.6 6.1
Growth geographies 13.6 9.3 0.3 23.2
Philips Group 4.8 5.6 0.5 10.9