Philips 2012 Annual Report Download - page 35
Download and view the complete annual report
Please find page 35 of the 2012 Philips annual report below. You can navigate through the pages in the report by either clicking on the pages listed below, or by using the keyword search tool below to find specific information within the annual report.-
 1
1 -
2
-
3
-
4
-
5
-
6
-
7
-
8
-
9
-
10
-
11
-
12
-
13
-
14
-
15
-
16
-
17
-
18
-
19
-
20
-
21
-
22
-
23
-
24
-
 25
25 -
 26
26 -
 27
27 -
 28
28 -
 29
29 -
 30
30 -
 31
31 -
 32
32 -
 33
33 -
 34
34 -
 35
35 -
 36
36 -
 37
37 -
 38
38 -
 39
39 -
 40
40 -
 41
41 -
 42
42 -
 43
43 -
 44
44 -
 45
45 -
46
-
47
-
48
-
49
-
50
-
51
-
52
-
53
-
54
-
55
-
56
-
57
-
58
-
59
-
60
-
61
-
62
-
63
-
64
-
65
-
66
-
67
-
68
-
69
-
70
-
71
-
72
-
73
-
74
-
75
-
76
-
77
-
78
-
79
-
80
-
81
-
82
-
83
-
84
-
85
-
86
-
87
-
88
-
89
-
90
-
91
-
92
-
93
-
94
-
95
-
96
-
97
-
98
-
99
-
100
-
101
-
102
-
103
-
104
-
105
-
106
-
107
-
108
-
109
-
110
-
111
-
112
-
113
-
114
-
115
-
116
-
117
-
118
-
119
-
120
-
121
-
122
-
123
-
124
-
125
-
126
-
127
-
128
-
129
-
130
-
131
-
132
-
133
-
134
-
135
-
136
-
137
-
138
-
139
-
140
-
141
-
142
-
143
-
144
-
145
-
146
-
147
-
148
-
149
-
150
-
151
-
152
-
153
-
154
-
155
-
156
-
157
-
158
-
159
-
160
-
161
-
162
-
163
-
164
-
165
-
166
-
167
-
168
-
169
-
170
-
171
-
172
-
173
-
174
-
175
-
176
-
177
-
178
-
179
-
180
-
181
-
182
-
183
-
184
-
185
-
186
-
187
-
188
-
189
-
190
-
191
-
192
-
193
-
194
-
195
-
196
-
197
-
198
-
199
-
200
-
201
-
202
-
203
-
204
-
205
-
206
-
207
-
208
-
209
-
210
-
211
-
212
-
213
-
214
-
215
-
216
-
217
-
218
-
219
-
220
-
221
-
222
-
223
-
224
-
225
-
226
-
227
-
228
-
229
-
230
-
231
 |
 |

5 Group performance 5.1 - 5.1.1
Annual Report 2012 35
5.1 Financial
performance
Management summary
Key data1)
in millions of euros unless otherwise stated
2010 2011 2012
Sales 22,287 22,579 24,788
EBITA2) 2,556 1,680 1,502
as a % of sales 11.5 7.4 6.1
EBIT 2,074 (269) 1,030
as a % of sales 9.3 (1.2) 4.2
Financial income and expenses (121) (240) (246)
Income tax expense (497) (283) (308)
Results of investments in associates 18 16 (214)
Income (loss) from continuing
operations 1,474 (776) 262
Income (loss) from discontinued
operations (26) (515) (31)
Net income (loss) 1,448 (1,291) 231
Net income (loss) per common share
in euros:
- basic 1.54 (1.36) 0.25
- diluted 1.53 (1.36) 0.25
Net operating capital (NOC)2) 11,897 10,372 9,307
Cash flows before financing activities2) 1,477 (525) 1,286
Employees (FTEs) 119,775 125,241 118,087
of which discontinued operations 3,610 3,353 −
1) Prior periods amounts have been revised to reflect a voluntarily adopted
accounting policy change, and immaterial adjustments throughout Annual
Report, see section 12.10, Significant accounting policies, of this Annual Report
2) For a reconciliation to the most directly comparable GAAP measures, see
chapter 15, Reconciliation of non-GAAP information, of this Annual Report
The year 2012
• Despite strong economic headwinds, we continued on
our steady path of improvement driven by our multi-
year change and performance program, Accelerate!.
We recorded 4% comparable sales growth (10%
nominal growth), with a strong contribution from
growth geographies. Healthcare and Consumer
Lifestyle delivered solid earnings, while Lighting gained
momentum in its turnaround. Net income for the year
amounted to EUR 231 million, and was impacted by
substantial restructuring charges as well as the
European Commission fine related to alleged violation
of competition rules in the Cathode-Ray Tube (CRT)
industry.
• Sales amounted to EUR 24.8 billion, a 10% nominal
increase for the year. Excluding favorable currency
effects and portfolio changes, comparable sales were
4% above 2011, driven by all three operating sectors.
Healthcare sales grew 6%, with solid growth in all
businesses. Lighting sales were 4% above 2011, with
strong growth coming from Light Sources &
Electronics, mainly fueled by market demand for LED,
and Automotive, partly tempered by a sales decline at
Lumileds. Sales at Consumer Lifestyle were 2% above
2011, with double-digit growth at Domestic Appliances
and Health & Wellness and mid-single-digit growth at
Personal Care, tempered by a sales decline at our
Lifestyle Entertainment business.
• Our growth geographies achieved 10% comparable
growth, while mature geographies grew by a modest
1%, as a result of the overall macroeconomic
developments and the continued weakness of the
Western European markets, particularly Southern
Europe. In 2012, growth geographies accounted for
35% of total sales, compared to 33% in 2011.
• EBIT amounted to EUR 1,030 million, or 4.2% of sales,
compared to a loss of EUR 269 million, or negative 1.2%
of sales, in 2011. Excluding impairment charges of EUR
1,355 million in 2011, significant EBIT improvement was
seen at Consumer Lifestyle and Healthcare, while
Lighting was impacted by charges related to
restructuring activities.
• We continued to re-align our portfolio to further focus
on expanding market-leadership positions across our
Healthcare, Consumer Lifestyle and Lighting sectors. In
2012, we completed the divestment of our Television
business to TP Vision, extended our partnership in
Senseo with Sara Lee and strengthened our Lifestyle
Entertainment platform in North America through the
signing of a distribution agreement with Funai.
Additionally, we completed the acquisition of Indal,
strengthening our position in outdoor lighting. In
January 2013 we announced an agreement to transfer
our Audio, Video, Multimedia and Accessories
businesses to Funai.
• In 2012 we generated EUR 2,198 million of cash flow
from operating activities, which was EUR 1,430 million
higher than in 2011. The increase was largely a result of
lower working capital requirements and higher cash
earnings. Our cash flows before financing activities
were EUR 1,811 million above the level of 2011, due to
higher cash flow from operating activities, higher
proceeds from divestments, and lower outflows related
to acquisitions of new businesses.
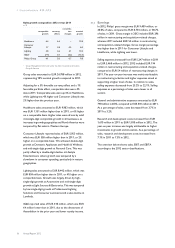
5.1.1 Sales
The composition of sales growth in percentage terms in
2012, compared to 2011, is presented in the table below.