Philips 2012 Annual Report Download - page 144
Download and view the complete annual report
Please find page 144 of the 2012 Philips annual report below. You can navigate through the pages in the report by either clicking on the pages listed below, or by using the keyword search tool below to find specific information within the annual report.-
 1
1 -
2
-
3
-
4
-
5
-
6
-
7
-
8
-
9
-
10
-
11
-
12
-
13
-
14
-
15
-
16
-
17
-
18
-
19
-
20
-
21
-
22
-
23
-
24
-
25
-
26
-
27
-
28
-
29
-
30
-
31
-
32
-
33
-
34
-
35
-
36
-
37
-
38
-
39
-
40
-
41
-
42
-
43
-
44
-
45
-
46
-
47
-
48
-
49
-
50
-
51
-
52
-
53
-
54
-
55
-
56
-
57
-
58
-
59
-
60
-
61
-
62
-
63
-
64
-
65
-
66
-
67
-
68
-
69
-
70
-
71
-
72
-
73
-
74
-
75
-
76
-
77
-
78
-
79
-
80
-
81
-
82
-
83
-
84
-
85
-
86
-
87
-
88
-
89
-
90
-
91
-
92
-
93
-
94
-
95
-
96
-
97
-
98
-
99
-
100
-
101
-
102
-
103
-
104
-
105
-
106
-
107
-
108
-
109
-
110
-
111
-
112
-
113
-
114
-
115
-
116
-
117
-
118
-
119
-
120
-
121
-
122
-
123
-
124
-
125
-
126
-
127
-
128
-
129
-
130
-
131
-
132
-
133
-
 134
134 -
 135
135 -
 136
136 -
 137
137 -
 138
138 -
 139
139 -
 140
140 -
 141
141 -
 142
142 -
 143
143 -
 144
144 -
 145
145 -
 146
146 -
 147
147 -
 148
148 -
 149
149 -
 150
150 -
 151
151 -
 152
152 -
 153
153 -
 154
154 -
155
-
156
-
157
-
158
-
159
-
160
-
161
-
162
-
163
-
164
-
165
-
166
-
167
-
168
-
169
-
170
-
171
-
172
-
173
-
174
-
175
-
176
-
177
-
178
-
179
-
180
-
181
-
182
-
183
-
184
-
185
-
186
-
187
-
188
-
189
-
190
-
191
-
192
-
193
-
194
-
195
-
196
-
197
-
198
-
199
-
200
-
201
-
202
-
203
-
204
-
205
-
206
-
207
-
208
-
209
-
210
-
211
-
212
-
213
-
214
-
215
-
216
-
217
-
218
-
219
-
220
-
221
-
222
-
223
-
224
-
225
-
226
-
227
-
228
-
229
-
230
-
231
 |
 |

4 5 12 Group financial statements 12.11 - 12.11
144 Annual Report 2012
the various Philips entities. For that purpose, apart from specific
allocation contracts for costs and revenues, general service agreements
(GSAs) are signed with a large number of group entities. Tax authorities
review the implementation of GSAs, apply benefit tests for particular
countries or audit the use of tax credits attached to GSAs and royalty
payments, and may reject the implemented procedures. Furthermore,
buy in/out situations in the case of (de)mergers could affect the tax
allocation of GSAs between countries. The same applies to the specific
allocation contracts.
Tax uncertainties due to disentanglements and acquisitions
When a subsidiary of Philips is disentangled, or a new company is
acquired, related tax uncertainties arise. Philips creates merger and
acquisition (M&A) teams for these disentanglements or acquisitions. In
addition to representatives from the involved sector, these teams
consist of specialists from various corporate functions and are formed,
amongst other things, to identify hidden tax uncertainties that could
subsequently surface when companies are acquired and to reduce tax
claims related to disentangled entities. These tax uncertainties are
investigated and assessed to mitigate tax uncertainties in the future as
much as possible. Several tax uncertainties may surface from M&A
activities. Examples of uncertainties are: applicability of the participation
exemption, allocation issues, and non-deductibility of parts of the
purchase price.
Tax uncertainties due to permanent establishments
In countries where e.g. Philips starts new operations or alters business
models, the issue of permanent establishment may arise. This is because
when operations in a country involves a Philips organization in another
country, there is a risk that tax claims will arise in the former country
as well as in the latter country.
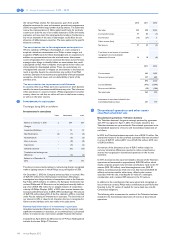
4Investments in associates
The changes during 2012 are as follows:
Investments in associates
loans investments total
Balance as of January 1, 2012 2 201 203
Changes:
Acquisitions/Additions − 13 13
Sales/Redemption (2) (1) (3)
Reclassifications − (6) (6)
Share in income − (8) (8)
Impairments − (5) (5)
Dividends declared − (15) (15)
Translation and exchange rate
differences − (2) (2)
Balance as of December 31,
2012 − 177 177
The share in income mainly relates to restructuring charges recognized
within a lighting venture in which Philips has a participation of 50%.
On December 5, 2012 the Company announced that it received a fine
of EUR 313 million from the European Commission following an
investigation into alleged violation of competition rules in the Cathode-
Ray Tubes (CRT) industry. In addition, the European Commission has
ordered Philips and LG Electronics to be jointly and severally liable to
pay a fine of EUR 392 million for an alleged violation of competition
rules by LG.Philips Displays (LPD), a 50/50 joint venture between the
Company and LG Electronics. In 2006, LPD went bankrupt. The amount
of EUR 196 million (being 50% of the fine related to LPD) is recorded
under Results relating to investments in associates. The book value of
our interest in LPD is valued at nil, therefore the loss is recognized in
Other current liabilities and is not visible in the table above.
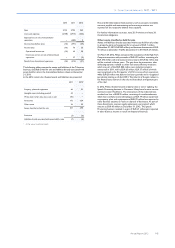
Summarized information of investments in associates
Unaudited summarized financial information on the Company’s most
significant investments in associates, on a combined basis, is presented
below. It is based on the most recent available financial information.
Included from April 2012 is the 30%-interest in TP Vision Holding which
includes the former Philips TV business.
2010 2011 2012
Net sales 353 408 2,534
Income before taxes 47 86 (7)
Income taxes (16) (27) 2
Other income (loss) − − −
Net income 31 59 (5)
Total share in net income of associates
recognized in the Consolidated
statements of income 14 18 (8)
2011 2012
Current assets 669 1,635
Non-current assets 227 485
896 2,120
Current liabilities (475) (1,544)
Non-current liabilities (58) (186)
Net asset value 363 390
Investments in associates included in the
Consolidated balance sheet 201 177
5Discontinued operations and other assets
classified as held for sale
Discontinued operations: Television business
The Television business’s long-term strategic partnership agreement
with TPV was signed on April 1, 2012. The results related to the
Television business are reported under Discontinued operations in the
Consolidated statements of income and Consolidated statements of
cash flows.
In 2012, the Television business reported a loss of EUR 31 million. Net
operational results of the discontinued operations after-tax amounted
to a loss of EUR 31 million (2011: loss of EUR 162 million; 2010: loss
of EUR 26 million).
At moment of the divestment a loss of EUR 5 million related to
currency translation differences reported in other comprehensive
income was recognized in discontinued operations in the income
statement.
In 2011, the total net loss reported related to the sale of the Television
operations and amounted to approximately EUR 380 million, which
mainly comprises present value of initial contributions made to the TV
venture (EUR 183 million), total disentanglement costs (EUR 81
million), contributed assets which were not fully recovered (EUR 66
million) and various smaller other items, offset by the revenue
associated with the sale, including the fair value of a contingent
consideration and a retained 30% interest in the TV venture.
In addition to the contributions that were agreed and recognized as
loss on onerous contract, Philips made commitments to provide further
financing to the TV venture if needed; for more deails see note 24,
Contractual obligations.
The following table summarizes the results of the Television business
included in the Consolidated statements of income as discontinued
operations.