Philips 2012 Annual Report Download - page 40
Download and view the complete annual report
Please find page 40 of the 2012 Philips annual report below. You can navigate through the pages in the report by either clicking on the pages listed below, or by using the keyword search tool below to find specific information within the annual report.-
 1
1 -
2
-
3
-
4
-
5
-
6
-
7
-
8
-
9
-
10
-
11
-
12
-
13
-
14
-
15
-
16
-
17
-
18
-
19
-
20
-
21
-
22
-
23
-
24
-
25
-
26
-
27
-
28
-
29
-
 30
30 -
 31
31 -
 32
32 -
 33
33 -
 34
34 -
 35
35 -
 36
36 -
 37
37 -
 38
38 -
 39
39 -
 40
40 -
 41
41 -
 42
42 -
 43
43 -
 44
44 -
 45
45 -
 46
46 -
 47
47 -
 48
48 -
 49
49 -
 50
50 -
51
-
52
-
53
-
54
-
55
-
56
-
57
-
58
-
59
-
60
-
61
-
62
-
63
-
64
-
65
-
66
-
67
-
68
-
69
-
70
-
71
-
72
-
73
-
74
-
75
-
76
-
77
-
78
-
79
-
80
-
81
-
82
-
83
-
84
-
85
-
86
-
87
-
88
-
89
-
90
-
91
-
92
-
93
-
94
-
95
-
96
-
97
-
98
-
99
-
100
-
101
-
102
-
103
-
104
-
105
-
106
-
107
-
108
-
109
-
110
-
111
-
112
-
113
-
114
-
115
-
116
-
117
-
118
-
119
-
120
-
121
-
122
-
123
-
124
-
125
-
126
-
127
-
128
-
129
-
130
-
131
-
132
-
133
-
134
-
135
-
136
-
137
-
138
-
139
-
140
-
141
-
142
-
143
-
144
-
145
-
146
-
147
-
148
-
149
-
150
-
151
-
152
-
153
-
154
-
155
-
156
-
157
-
158
-
159
-
160
-
161
-
162
-
163
-
164
-
165
-
166
-
167
-
168
-
169
-
170
-
171
-
172
-
173
-
174
-
175
-
176
-
177
-
178
-
179
-
180
-
181
-
182
-
183
-
184
-
185
-
186
-
187
-
188
-
189
-
190
-
191
-
192
-
193
-
194
-
195
-
196
-
197
-
198
-
199
-
200
-
201
-
202
-
203
-
204
-
205
-
206
-
207
-
208
-
209
-
210
-
211
-
212
-
213
-
214
-
215
-
216
-
217
-
218
-
219
-
220
-
221
-
222
-
223
-
224
-
225
-
226
-
227
-
228
-
229
-
230
-
231
 |
 |

5 Group performance 5.1.8 - 5.1.10
40 Annual Report 2012
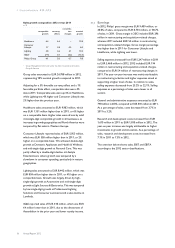
In 2012 there was a EUR 1 million gain on the sale of
securities. In 2011, income from the sale of securities
totaled EUR 51 million, including a EUR 44 million gain on
the sale of the remaining shares in TCL and a EUR 6 million
gain on the sale of shares of Digimarc.
Impairments on securities
in millions of euros
2010 2011 2012
TPV − (25) −
Chi-Mei Innolux − (4) (1)
BG Medicine − (2) (1)
Prime Technology (2) (1) −
Tendris − − (5)
Gilde III − − (1)
Other − (2) −
(2) (34) (8)
Impairment charges in 2012 amounted to EUR 8 million,
mainly from shareholdings in Tendris. In 2011, impairment
charges amounted to EUR 34 million, mainly from
shareholdings in TPV Technologies Ltd.
Other financial income was a EUR 2 million gain in 2012,
compared to a net expense of EUR 47 million in 2011. In
2012, there was a EUR 46 million gain related to a change
in estimate on the valuation of long-term derivative
contracts and remaining other financial income of EUR 20
million. This is offset by EUR 42 million other financing
charges and a EUR 22 million accretion expense (mainly
associated with discounted provisions).
Other financial expenses in 2011 primarily consisted of a
EUR 35 million other financing charge and a EUR 33
million accretion expense (mainly associated with
discounted provisions) offset by EUR 11 million dividend
income and other financial income, including a net gain of
EUR 6 million mostly from the revaluation impact of the
option related to NXP.
For further information, refer to note 2, Financial income
and expenses.
5.1.8 Income taxes
Income taxes amounted to EUR 308 million, compared to
EUR 283 million in 2011. The year-on-year increase was
largely attributable to higher taxable earnings.
The tax burden in 2012 corresponded to an effective
income tax rate of 39.3%, compared to negative 55.6% in
2011. In 2011, the negative effective income tax rate was
attributable to goodwill impairment losses of EUR 1,355
million, which are largely non-tax-deductible. The
effective income tax rate in 2012 included the impact of
the non-tax-deductible charge of EUR 509 million arising
from the European Commission ruling related to the
alleged violation of competition rules in the Cathode-
Ray Tube (CRT) industry.
For 2013, the effective tax rate excluding incidental non-
taxable items is expected to be between 32% and 35%.
For further information, refer to note 3, Income taxes.
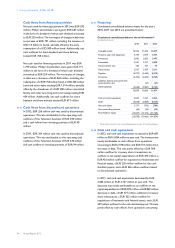
5.1.9 Results of investments in associates
The results related to investments in associates declined
from income of EUR 16 million in 2011 to a loss of EUR
214 million in 2012, largely attributable to a charge of EUR
196 million related to the former LG.Philips Displays joint
venture.
The European Commission imposed fines in relation to
alleged violations of competition rules in the Cathode-
Ray Tube industry. Philips recorded a total charge of EUR
509 million, of which EUR 313 million is directly related
to Philips and therefore recorded in Income from
Operations, while EUR 196 million relates to LG.Philips
Displays and is therefore recorded in results of
investments in associates.
Results of investments in associates
in millions of euros
2010 2011 2012
Company’s participation in income 14 18 (8)
Results on sale of shares 5 − −
(Reversal of) investment impairment
and other charges (1) (2) (206)
18 16 (214)
The Company’s participation in income decreased from
EUR 18 million in 2011 to negative EUR 8 million in 2012.
The loss in 2012 was mainly attributable to the results of
EMGO, while the income in 2011 was mainly due to the
results of Intertrust.
For further information, refer to note 4, Investments in
associates.
5.1.10 Non-controlling interests
Net income attributable to non-controlling interests
amounted to EUR 5 million in 2012, compared to EUR 4
million in 2011.