Philips 2012 Annual Report Download - page 38
Download and view the complete annual report
Please find page 38 of the 2012 Philips annual report below. You can navigate through the pages in the report by either clicking on the pages listed below, or by using the keyword search tool below to find specific information within the annual report.-
 1
1 -
2
-
3
-
4
-
5
-
6
-
7
-
8
-
9
-
10
-
11
-
12
-
13
-
14
-
15
-
16
-
17
-
18
-
19
-
20
-
21
-
22
-
23
-
24
-
25
-
26
-
27
-
 28
28 -
 29
29 -
 30
30 -
 31
31 -
 32
32 -
 33
33 -
 34
34 -
 35
35 -
 36
36 -
 37
37 -
 38
38 -
 39
39 -
 40
40 -
 41
41 -
 42
42 -
 43
43 -
 44
44 -
 45
45 -
 46
46 -
 47
47 -
 48
48 -
49
-
50
-
51
-
52
-
53
-
54
-
55
-
56
-
57
-
58
-
59
-
60
-
61
-
62
-
63
-
64
-
65
-
66
-
67
-
68
-
69
-
70
-
71
-
72
-
73
-
74
-
75
-
76
-
77
-
78
-
79
-
80
-
81
-
82
-
83
-
84
-
85
-
86
-
87
-
88
-
89
-
90
-
91
-
92
-
93
-
94
-
95
-
96
-
97
-
98
-
99
-
100
-
101
-
102
-
103
-
104
-
105
-
106
-
107
-
108
-
109
-
110
-
111
-
112
-
113
-
114
-
115
-
116
-
117
-
118
-
119
-
120
-
121
-
122
-
123
-
124
-
125
-
126
-
127
-
128
-
129
-
130
-
131
-
132
-
133
-
134
-
135
-
136
-
137
-
138
-
139
-
140
-
141
-
142
-
143
-
144
-
145
-
146
-
147
-
148
-
149
-
150
-
151
-
152
-
153
-
154
-
155
-
156
-
157
-
158
-
159
-
160
-
161
-
162
-
163
-
164
-
165
-
166
-
167
-
168
-
169
-
170
-
171
-
172
-
173
-
174
-
175
-
176
-
177
-
178
-
179
-
180
-
181
-
182
-
183
-
184
-
185
-
186
-
187
-
188
-
189
-
190
-
191
-
192
-
193
-
194
-
195
-
196
-
197
-
198
-
199
-
200
-
201
-
202
-
203
-
204
-
205
-
206
-
207
-
208
-
209
-
210
-
211
-
212
-
213
-
214
-
215
-
216
-
217
-
218
-
219
-
220
-
221
-
222
-
223
-
224
-
225
-
226
-
227
-
228
-
229
-
230
-
231
 |
 |

5 Group performance 5.1.4 - 5.1.6
38 Annual Report 2012
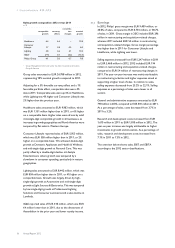
by 5% compared to 2011. Total 2012 marketing
investment as a percentage of sales approximated 3.6%,
compared to 4.2% in 2011.
Philips increased its brand value by 5% in 2012 to over
USD 9 billion in the ranking of the world’s 100 most
valuable brands, as measured by Interbrand. In the 2012
listing, Philips maintained its ranking as the 41st most
valuable brand in the world.
Marketing expenses
in millions of euros ■-in value----as a % of sales
1,200
900
600
300
0
3.8
832
2008
3.6
714
2009
3.7
835
2010
4.2
938
2011
3.6
890
2012
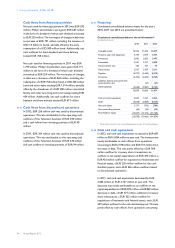
5.1.4 Research and development
Research and development costs increased from EUR
1,610 million in 2011 to EUR 1,810 million in 2012. The
year-on-year increase was largely attributable to higher
investments in growth and innovation, including an
increased focus on new value spaces. As a percentage of
sales, research and development costs increased from
7.1% in 2011 to 7.3%.
Research and development expenses
in millions of euros ■-in value----as a % of sales
2,000
1,500
1,000
500
0
7.8
1,684
2008
7.7
1,542
2009
6.7
1,493
2010
7.1
1,610
2011
7.3
1,810
2012
Research and development costs within Healthcare
increased EUR 63 million, mainly at Imaging Systems and
Home Healthcare Solutions. At Lighting, research and
development costs increased EUR 44 million, primarily at
Lumileds and our Controls business within Professional
Lighting Solutions. At Consumer Lifestyle, research and
development spending was EUR 12 million lower than in
2011, mainly as a result of the re-positioning of the
Lifestyle Entertainment portfolio. In Innovation, Group &
Services, R&D expenses increased by EUR 105 million,
driven by investments in new value spaces as well as
innovation and design initiatives.
Research and development expenses per sector
in millions of euros
2010 2011 2012
Healthcare 698 740 803
Consumer Lifestyle 282 313 301
Lighting 355 409 453
Innovation, Group & Services 158 148 253
Philips Group 1,493 1,610 1,810
5.1.5 Pensions
The net periodic pension costs of defined-benefit pension
plans amounted to a credit of EUR 38 million in 2012,
compared to a cost of EUR 18 million in 2011. The
defined-contribution pension cost amounted to EUR 142
million, EUR 22 million higher than in 2011.
The funded status of our defined-benefit plans improved
in 2012, in spite of decreasing discount rates and
improved life expectancy assumptions in the Netherlands
and UK plans. The surpluses of the plans in the
Netherlands and UK increased, but as we do not
recognize the surplus in these countries the net balance
sheet position was not impacted.
In 2012, a prior-service cost gain of EUR 25 million was
recognized in one of our major retiree medical plans. The
plan change reduced certain company post-retirement
risks. In the Netherlands a curtailment gain was
recognized of EUR 25 million in the pension plan in 2012
due to headcount reductions as a result of our
restructuring activities. In 2012, further steps were taken
to manage the financial exposure to defined-benefit plans
such as the buy-out of the Swiss Pension Fund by an
insurance company.
The overall curtailment gain for 2011 was EUR 18 million
and the prior-service cost gain was EUR 20 million.
For further information, refer to note 29, Pensions and
other postretirement benefits.
5.1.6 Restructuring and impairment charges
2012 included EUR 530 million in restructuring and
related asset impairment charges. In addition to the annual
goodwill impairment tests for Philips, trigger-based
impairment tests were performed during the year,
resulting in no goodwill impairments.