Philips 2012 Annual Report Download - page 184
Download and view the complete annual report
Please find page 184 of the 2012 Philips annual report below. You can navigate through the pages in the report by either clicking on the pages listed below, or by using the keyword search tool below to find specific information within the annual report.-
 1
1 -
2
-
3
-
4
-
5
-
6
-
7
-
8
-
9
-
10
-
11
-
12
-
13
-
14
-
15
-
16
-
17
-
18
-
19
-
20
-
21
-
22
-
23
-
24
-
25
-
26
-
27
-
28
-
29
-
30
-
31
-
32
-
33
-
34
-
35
-
36
-
37
-
38
-
39
-
40
-
41
-
42
-
43
-
44
-
45
-
46
-
47
-
48
-
49
-
50
-
51
-
52
-
53
-
54
-
55
-
56
-
57
-
58
-
59
-
60
-
61
-
62
-
63
-
64
-
65
-
66
-
67
-
68
-
69
-
70
-
71
-
72
-
73
-
74
-
75
-
76
-
77
-
78
-
79
-
80
-
81
-
82
-
83
-
84
-
85
-
86
-
87
-
88
-
89
-
90
-
91
-
92
-
93
-
94
-
95
-
96
-
97
-
98
-
99
-
100
-
101
-
102
-
103
-
104
-
105
-
106
-
107
-
108
-
109
-
110
-
111
-
112
-
113
-
114
-
115
-
116
-
117
-
118
-
119
-
120
-
121
-
122
-
123
-
124
-
125
-
126
-
127
-
128
-
129
-
130
-
131
-
132
-
133
-
134
-
135
-
136
-
137
-
138
-
139
-
140
-
141
-
142
-
143
-
144
-
145
-
146
-
147
-
148
-
149
-
150
-
151
-
152
-
153
-
154
-
155
-
156
-
157
-
158
-
159
-
160
-
161
-
162
-
163
-
164
-
165
-
166
-
167
-
168
-
169
-
170
-
171
-
172
-
173
-
 174
174 -
 175
175 -
 176
176 -
 177
177 -
 178
178 -
 179
179 -
 180
180 -
 181
181 -
 182
182 -
 183
183 -
 184
184 -
 185
185 -
 186
186 -
 187
187 -
 188
188 -
 189
189 -
 190
190 -
 191
191 -
 192
192 -
 193
193 -
 194
194 -
195
-
196
-
197
-
198
-
199
-
200
-
201
-
202
-
203
-
204
-
205
-
206
-
207
-
208
-
209
-
210
-
211
-
212
-
213
-
214
-
215
-
216
-
217
-
218
-
219
-
220
-
221
-
222
-
223
-
224
-
225
-
226
-
227
-
228
-
229
-
230
-
231
 |
 |

D 13 Company financial statements 13.4 - 13.4
184 Annual Report 2012
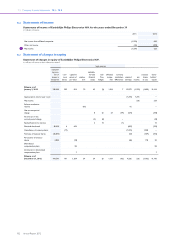
In 2012, receivables increased by EUR 4,782 million, which largely
relates to increased receivables with affiliated companies of EUR 5,011
million. From July 2012, cash transactions with US-based group
companies are executed directly through Koninklijke Philips Electronics
(KPENV) resulting in significant short term intercompany receivables
and payables. Consequently, the intercompany receivables stated under
‘Affiliated Companies’ are significantly higher compared to previous
years.
DShareholders’ equity
Common shares
As of December 31, 2012, the issued and fully paid share capital consists
of 957,132,962 common shares, each share having a par value of EUR
0.20.
In May 2012, the Company settled a dividend of EUR 0.75 per common
share, representing a total value of EUR 687 million. Shareholders could
elect for a cash dividend or a share dividend. Approximately 62.4% of
the shareholders elected for a share dividend, resulting in the issuance
of 30,522,107 new common shares. The settlement of the cash dividend
resulted in a payment of EUR 259 million.
Preference shares
The ‘Stichting Preferente Aandelen Philips’ has been granted the right
to acquire preference shares in the Company. Such right has not been
exercised. As a means to protect the Company and its stakeholders
against an unsolicited attempt to (de facto) take over control of the
Company, the General Meeting of Shareholders in 1989 adopted
amendments to the Company’s articles of association that allow the
Board of Management and the Supervisory Board to issue (rights to
acquire) preference shares to a third party. As of December 31, 2012,
no preference shares have been issued.
Option rights/restricted shares
The Company has granted stock options on its common shares and
rights to receive common shares in the future. Please refer to note 30,
Share-based compensation, which is deemed incorporated and
repeated herein by reference.
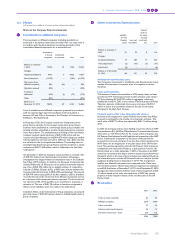
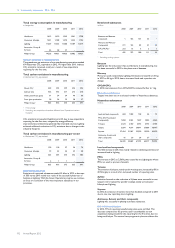
Treasury shares
In connection with the Company’s share repurchase programs, shares
which have been repurchased and are held in treasury for (i) delivery
upon exercise of options and convertible personnel debentures and
under restricted share programs and employee share purchase
programs, and (ii) capital reduction purposes, are accounted for as a
reduction of shareholders’ equity. Treasury shares are recorded at
cost, representing the market price on the acquisition date. When
issued, shares are removed from treasury shares on a FIFO basis.
Any difference between the cost and the cash received at the time
treasury shares are issued, is recorded in capital in excess of par value,
except in the situation in which the cash received is lower than cost,
and capital in excess of par has been depleted.
The following transactions took place resulting from employee option
and share plans:
2011 2012
Shares acquired 32,484 5,147
Average market price EUR 19.94 EUR 17.86
Amount paid EUR 1 million EUR 0 million
Shares delivered 4,200,181 4,844,898
Average market price EUR 20.54 EUR 24.39
Amount received EUR 87 million EUR 118 million
Total shares in treasury at
year-end 33,552,705 28,712,954
Total cost EUR 965 million EUR 847 million
In order to reduce share capital, the following transactions took place in
2012 (there were no transactions to reduce share capital in 2011):
2011 2012
Shares acquired 47,475,840 46,865,485
Average market price EUR 14.74 EUR 16.41
Amount paid EUR 700 million EUR 769 million
Reduction of capital stock − 82,364,590
Total shares in treasury at
year-end 49,327,838 13,828,733
Total cost EUR 725 million EUR 256 million
Dividend distribution
A proposal will be submitted to the 2013 General Meeting of
Shareholders to pay a dividend of EUR 0.75 per common share, in cash
or shares at the option of the shareholder, from the 2012 net income
and retained earnings of the Company.
Legal reserves
As of December 31, 2012, legal reserves relate to the revaluation of
assets and liabilities of acquired companies in the context of multi-
stage acquisitions of EUR 54 million (2011: EUR 70 million), unrealized
gains on available-for-sale financial assets of EUR 54 million (2011: EUR
45 million), unrealized gains on cash flow hedges of EUR 20 million
(2011: unrealized losses of EUR 9 million), ‘affiliated companies’ of EUR
1,161 million (2011: EUR 1,094 million) and unrealized currency
translation losses of EUR 93 million (2011: gains of EUR 7 million).
The item ‘affiliated companies’ relates to the ‘wettelijke reserve
deelnemingen’, which is required by Dutch law. This reserve relates to
any legal or economic restrictions on the ability of affiliated companies
to transfer funds to the parent company in the form of dividends.
Limitations in the distribution of shareholders’ equity
Pursuant to Dutch law, limitations exist relating to the distribution of
shareholders’ equity of EUR 1,480 million (2011: EUR 1,418 million).
As at December 31, 2012, such limitations relate to common shares of
EUR 191 million (2011: EUR 202 million) as well as to legal reserves
included under ‘revaluation’ of EUR 54 million (2011: EUR 70 million),
available-for-sale financial assets of EUR 54 million (2011: EUR 45
million), unrealized gains on cash flow hedges of EUR 20 million and
‘affiliated companies’ of EUR 1,161 million (2011: EUR 1,094 million).
The 2011 limitation included unrealized gains of currency translations
of EUR 7 million, that are negative in 2012 (see explanation below).
In general unrealized gains relating to available-for-sale financial assets
and cash flow hedges cannot be distributed as part of shareholders’
equity as they form part of the legal reserves protected under Dutch
law. By their nature, unrealized losses relating to currency translation
differences reduce shareholders’ equity, and thereby distributable
amounts.
Therefore, gains related to available-for-sale financial assets (2012: EUR
54 million) and cash flow hedges (2012: EUR 20 million) included in legal
reserves limit the distribution of shareholders’ equity. The unrealized
losses related to currency translation (2012: EUR 93 million) reduce
the distributable amount by their nature.