Philips 2012 Annual Report Download - page 162
Download and view the complete annual report
Please find page 162 of the 2012 Philips annual report below. You can navigate through the pages in the report by either clicking on the pages listed below, or by using the keyword search tool below to find specific information within the annual report.-
 1
1 -
2
-
3
-
4
-
5
-
6
-
7
-
8
-
9
-
10
-
11
-
12
-
13
-
14
-
15
-
16
-
17
-
18
-
19
-
20
-
21
-
22
-
23
-
24
-
25
-
26
-
27
-
28
-
29
-
30
-
31
-
32
-
33
-
34
-
35
-
36
-
37
-
38
-
39
-
40
-
41
-
42
-
43
-
44
-
45
-
46
-
47
-
48
-
49
-
50
-
51
-
52
-
53
-
54
-
55
-
56
-
57
-
58
-
59
-
60
-
61
-
62
-
63
-
64
-
65
-
66
-
67
-
68
-
69
-
70
-
71
-
72
-
73
-
74
-
75
-
76
-
77
-
78
-
79
-
80
-
81
-
82
-
83
-
84
-
85
-
86
-
87
-
88
-
89
-
90
-
91
-
92
-
93
-
94
-
95
-
96
-
97
-
98
-
99
-
100
-
101
-
102
-
103
-
104
-
105
-
106
-
107
-
108
-
109
-
110
-
111
-
112
-
113
-
114
-
115
-
116
-
117
-
118
-
119
-
120
-
121
-
122
-
123
-
124
-
125
-
126
-
127
-
128
-
129
-
130
-
131
-
132
-
133
-
134
-
135
-
136
-
137
-
138
-
139
-
140
-
141
-
142
-
143
-
144
-
145
-
146
-
147
-
148
-
149
-
150
-
151
-
 152
152 -
 153
153 -
 154
154 -
 155
155 -
 156
156 -
 157
157 -
 158
158 -
 159
159 -
 160
160 -
 161
161 -
 162
162 -
 163
163 -
 164
164 -
 165
165 -
 166
166 -
 167
167 -
 168
168 -
 169
169 -
 170
170 -
 171
171 -
 172
172 -
173
-
174
-
175
-
176
-
177
-
178
-
179
-
180
-
181
-
182
-
183
-
184
-
185
-
186
-
187
-
188
-
189
-
190
-
191
-
192
-
193
-
194
-
195
-
196
-
197
-
198
-
199
-
200
-
201
-
202
-
203
-
204
-
205
-
206
-
207
-
208
-
209
-
210
-
211
-
212
-
213
-
214
-
215
-
216
-
217
-
218
-
219
-
220
-
221
-
222
-
223
-
224
-
225
-
226
-
227
-
228
-
229
-
230
-
231
 |
 |

12 Group financial statements 12.11 - 12.11
162 Annual Report 2012
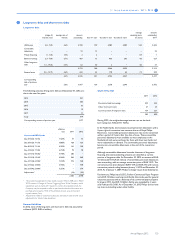
The 2010 costs were impacted by the recognition of EUR 119 million
of negative prior service costs. These resulted from a reduction of
pension benefits expected to be paid in the future, in part due to a
change in indexation. In 2010, a curtailment gain of EUR 9 million in one
of our retiree medical plans was recognized due to the partial closure
of a US site.
The table below provides a summary of the changes in the defined-
benefit obligations for defined-benefit pension plans and the fair value
of their plan assets for 2012 and 2011. It also provides a reconciliation of
the funded status of these plans to the amounts recognized in the
Consolidated balance sheets.
2011 2012
Netherlands other total Netherlands other total
Defined-benefit obligation at the beginning of year 12,226 7,940 20,166 13,493 8,920 22,413
Service cost 127 73 200 174 86 260
Interest cost 557 404 961 509 387 896
Employee contributions − 3 3 − 4 4
Actuarial losses 1,307 848 2,155 1,215 423 1,638
Plan amendments − (21) (21) − − −
Acquisitions − 3 3 − − −
Divestments − − − − (13) (13)
Settlements − (52) (52) − (294) (294)
Curtailments − (19) (19) (25) (6) (31)
Reclassifications − − − − − −
Benefits paid (724) (431) (1,155) (716) (465) (1,181)
Exchange rate differences − 168 168 − (34) (34)
Miscellaneous − 4 4 − 12 12
Defined-benefit obligation at end of year 13,493 8,920 22,413 14,650 9,020 23,670
Present value of funded obligations at end of year 13,486 8,102 21,588 14,643 8,167 22,810
Present value of unfunded obligations at end of year 7 818 825 7 853 860
2011 2012
Netherlands other total Netherlands other total
Fair value of plan assets at beginning of year 13,606 6,474 20,080 13,946 7,303 21,249
Expected return on plan assets 713 389 1,102 739 429 1,168
Actuarial gains and (losses) on plan assets 155 483 638 1,025 363 1,388
Employee contributions − 3 3 − 4 4
Employer contributions 196 243 439 209 216 425
Acquisitions − − − − − −
Divestments − − − − (1) (1)
Settlements − (51) (51) − (294) (294)
Benefits paid (724) (371) (1,095) (716) (407) (1,123)
Exchange rate differences − 133 133 − (25) (25)
Miscellaneous − − − − − −
Fair value of plan assets at end of year 13,946 7,303 21,249 15,203 7,588 22,791
Funded status 453 (1,617) (1,164) 553 (1,432) (879)
Unrecognized prior-service cost − 5 5 − 4 4
Unrecognized net assets (460) (399) (859) (560) (587) (1,147)
Net balance sheet position (7) (2,011) (2,018) (7) (2,015) (2,022)