Philips 2012 Annual Report Download - page 59
Download and view the complete annual report
Please find page 59 of the 2012 Philips annual report below. You can navigate through the pages in the report by either clicking on the pages listed below, or by using the keyword search tool below to find specific information within the annual report.-
 1
1 -
2
-
3
-
4
-
5
-
6
-
7
-
8
-
9
-
10
-
11
-
12
-
13
-
14
-
15
-
16
-
17
-
18
-
19
-
20
-
21
-
22
-
23
-
24
-
25
-
26
-
27
-
28
-
29
-
30
-
31
-
32
-
33
-
34
-
35
-
36
-
37
-
38
-
39
-
40
-
41
-
42
-
43
-
44
-
45
-
46
-
47
-
48
-
 49
49 -
 50
50 -
 51
51 -
 52
52 -
 53
53 -
 54
54 -
 55
55 -
 56
56 -
 57
57 -
 58
58 -
 59
59 -
 60
60 -
 61
61 -
 62
62 -
 63
63 -
 64
64 -
 65
65 -
 66
66 -
 67
67 -
 68
68 -
 69
69 -
70
-
71
-
72
-
73
-
74
-
75
-
76
-
77
-
78
-
79
-
80
-
81
-
82
-
83
-
84
-
85
-
86
-
87
-
88
-
89
-
90
-
91
-
92
-
93
-
94
-
95
-
96
-
97
-
98
-
99
-
100
-
101
-
102
-
103
-
104
-
105
-
106
-
107
-
108
-
109
-
110
-
111
-
112
-
113
-
114
-
115
-
116
-
117
-
118
-
119
-
120
-
121
-
122
-
123
-
124
-
125
-
126
-
127
-
128
-
129
-
130
-
131
-
132
-
133
-
134
-
135
-
136
-
137
-
138
-
139
-
140
-
141
-
142
-
143
-
144
-
145
-
146
-
147
-
148
-
149
-
150
-
151
-
152
-
153
-
154
-
155
-
156
-
157
-
158
-
159
-
160
-
161
-
162
-
163
-
164
-
165
-
166
-
167
-
168
-
169
-
170
-
171
-
172
-
173
-
174
-
175
-
176
-
177
-
178
-
179
-
180
-
181
-
182
-
183
-
184
-
185
-
186
-
187
-
188
-
189
-
190
-
191
-
192
-
193
-
194
-
195
-
196
-
197
-
198
-
199
-
200
-
201
-
202
-
203
-
204
-
205
-
206
-
207
-
208
-
209
-
210
-
211
-
212
-
213
-
214
-
215
-
216
-
217
-
218
-
219
-
220
-
221
-
222
-
223
-
224
-
225
-
226
-
227
-
228
-
229
-
230
-
231
 |
 |
5 Group performance 5.3.2 - 5.3.3
Annual Report 2012 59
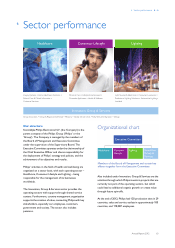
Lighting
In 2012 Philips introduced the next generation shop
accent lighting, namely CDM Evolution. The Evolution
lamp is 10% more-energy efficient than its predecessor
(CDM Elite). A Philips MASTERColour Evolution lamp is
now on average 30% more energy-efficient than a CDM
standard lamp introduced in 1994, and 10-20% more
energy-efficient that the average competition. The
Evolution lamp is also much longer-lasting. In the past
average lifetime was around 12,000 hours. The Evolution
range extends lifetime beyond 20,000 hours, almost
halving the need for lamp replacement and therefore
helping to reduce waste levels.
5.3.3 Green Operations
The Green Operations program focuses on the main
contributors to climate change, recycling of waste,
reduction of water consumption and reduction of
emissions of restricted and hazardous substances.
Full details, can be found in chapter 14, Sustainability
statements, of this Annual Report.
Carbon footprint and energy efficiency
In 2012, we achieved our EcoVision4 carbon reduction
target as our operational CO2 emissions decreased 25%
compared to 2007, the baseline year. We were able to
achieve this significant reduction for a number of reasons,
including our ongoing energy efficiency improvement
program, Green logistics, our changing industrial
footprint, and the increase in purchased electricity from
renewable sources. These were, however, partly offset by
increased CO2 emissions from manufacturing (+1%
compared to 2011), due to a significant increase in
reporting sites (acquisitions).
In 2012, CO2 emissions from non-industrial sites
decreased 9%, partly because of our continued focus on
the most efficient use of facility space, for instance with
our Work Place Innovation program (which enables flex-
working), but also due to the increased share of purchased
electricity from renewable sources.
Due to a stringent travel policy, total emissions from
business travel decreased 15% in 2012. We continue to
promote video conferencing as an alternative to travel; as
a result air travel is down 24%, saving a total of 38
kilotonnes CO2 emissions. In 2012, logistics CO2
emissions decreased 17%, because of the exclusion of the
logistic movements related to the TV business, our
continued focus on efficient container utilization, reduced
mileage in road freight, and the shift from air to sea freight,
which is cleaner and more cost-effective.
Our operational energy efficiency improved 7%, from 1.24
terajoules per million euro sales in 2011 to 1.15 terajoules
per million euro sales in 2012 as a result of a lower carbon
footprint and higher sales.
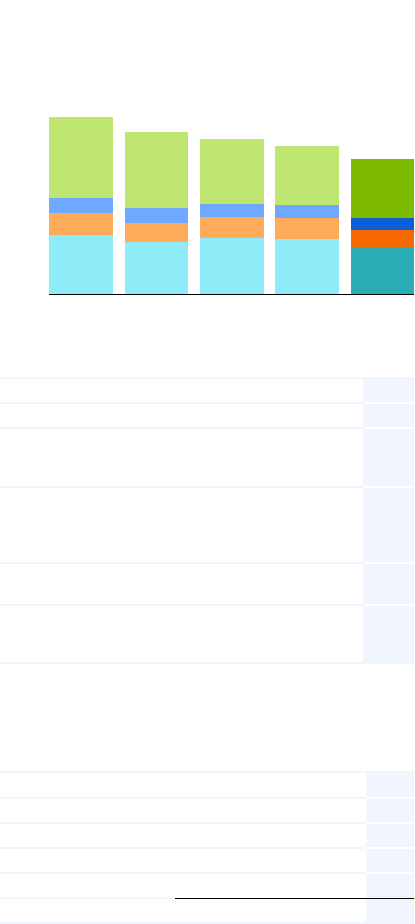
Operational carbon footprint
in kilotonnes CO2-equivalent ■-logistics_■-business travel
■-non-industrial operations_■-manufacturing
2,500
2,000
1,500
1,000
500
0
2008
706
265
181
959
2,111
2009
627
220
174
909
1,930
2010
672
247
159
767
1,845
2011
657
256
155
703
1,771
2012
546
217
142
709
1,614
Ratios relating to carbon emissions and energy use
2008 2009 2010 2011 2012
Operational CO2
emissions in kilotonnes
CO2-equivalent 2,111 1,930 1,845 1,771 1,614
Operational CO2
efficiency in tonnes CO2-
equivalent per million
euro sales 80 83 73 70 65
Operational energy use in
terajoules 33,831 31,145 32,766 31,402 28,405
Operational energy
efficiency in terajoules
per million euro sales 1.28 1.34 1.29 1.24 1.15
Operational carbon footprint by Greenhouse Gas
Protocol scopes
in kilotonnes CO2-equivalent
2008 2009 2010 2011 2012
Scope 1 467 447 441 431 443
Scope 2 673 636 485 427 409
Scope 3 971 847 919 913 762
Philips Group 2,111 1,930 1,845 1,771 1,614
Water
Total water intake in 2012 was 4.9 million m3, about 12%
higher than in 2011. This increase was mainly due to new
acquisitions that started to report in 2012, which
accounted for 11% of group water consumption in 2012
as well as increased water use at Lighting Lumileds sites.
At Consumer Lifestyle the total water consumption went
down by 10%, partially due to the divestment of Television
activities.