Philips 2012 Annual Report Download - page 211
Download and view the complete annual report
Please find page 211 of the 2012 Philips annual report below. You can navigate through the pages in the report by either clicking on the pages listed below, or by using the keyword search tool below to find specific information within the annual report.-
 1
1 -
2
-
3
-
4
-
5
-
6
-
7
-
8
-
9
-
10
-
11
-
12
-
13
-
14
-
15
-
16
-
17
-
18
-
19
-
20
-
21
-
22
-
23
-
24
-
25
-
26
-
27
-
28
-
29
-
30
-
31
-
32
-
33
-
34
-
35
-
36
-
37
-
38
-
39
-
40
-
41
-
42
-
43
-
44
-
45
-
46
-
47
-
48
-
49
-
50
-
51
-
52
-
53
-
54
-
55
-
56
-
57
-
58
-
59
-
60
-
61
-
62
-
63
-
64
-
65
-
66
-
67
-
68
-
69
-
70
-
71
-
72
-
73
-
74
-
75
-
76
-
77
-
78
-
79
-
80
-
81
-
82
-
83
-
84
-
85
-
86
-
87
-
88
-
89
-
90
-
91
-
92
-
93
-
94
-
95
-
96
-
97
-
98
-
99
-
100
-
101
-
102
-
103
-
104
-
105
-
106
-
107
-
108
-
109
-
110
-
111
-
112
-
113
-
114
-
115
-
116
-
117
-
118
-
119
-
120
-
121
-
122
-
123
-
124
-
125
-
126
-
127
-
128
-
129
-
130
-
131
-
132
-
133
-
134
-
135
-
136
-
137
-
138
-
139
-
140
-
141
-
142
-
143
-
144
-
145
-
146
-
147
-
148
-
149
-
150
-
151
-
152
-
153
-
154
-
155
-
156
-
157
-
158
-
159
-
160
-
161
-
162
-
163
-
164
-
165
-
166
-
167
-
168
-
169
-
170
-
171
-
172
-
173
-
174
-
175
-
176
-
177
-
178
-
179
-
180
-
181
-
182
-
183
-
184
-
185
-
186
-
187
-
188
-
189
-
190
-
191
-
192
-
193
-
194
-
195
-
196
-
197
-
198
-
199
-
200
-
 201
201 -
 202
202 -
 203
203 -
 204
204 -
 205
205 -
 206
206 -
 207
207 -
 208
208 -
 209
209 -
 210
210 -
 211
211 -
 212
212 -
 213
213 -
 214
214 -
 215
215 -
 216
216 -
 217
217 -
 218
218 -
 219
219 -
 220
220 -
 221
221 -
222
-
223
-
224
-
225
-
226
-
227
-
228
-
229
-
230
-
231
 |
 |

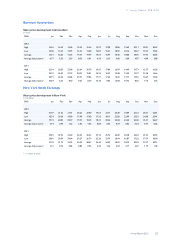
15 Reconciliation of non-GAAP information 15 - 15
Annual Report 2012 211
Net operating capital to total assets
Philips Group Healthcare Consumer Lifestyle Lighting
Innovation, Group
& Services
2012
Net operating capital (NOC) 9,307 7,976 1,217 4,635 (4,521)
Eliminate liabilities comprised in NOC:
- payables/liabilities 10,283 2,760 1,741 1,695 4,087
- intercompany accounts − 71 45 37 (153)
- provisions 2,969 355 322 581 1,711
Include assets not comprised in NOC:
- investments in associates 177 86 − 22 69
- other non-current financial assets 549 − − − 549
- deferred tax assets 1,917 − − − 1,917
- liquid assets 3,834 − − − 3,834
29,036 11,248 3,325 6,970 7,493
Assets classified as held for sale 43
Total assets 29,079
2011
Net operating capital (NOC) 10,372 8,418 884 4,965 (3,895)
Eliminate liabilities comprised in NOC:
- payables/liabilities 10,353 2,697 2,309 1,593 3,754
- intercompany accounts − 103 87 51 (241)
- provisions 2,694 287 558 282 1,567
Include assets not comprised in NOC:
- investments in associates 203 86 3 23 91
- other non-current financial assets 346 − − − 346
- deferred tax assets 1,729 − − − 1,729
- liquid assets 3,147 − − − 3,147
28,844 11,591 3,841 6,914 6,498
Assets classified as held for sale 551
Total assets 29,395
2010
Net operating capital (NOC) 11,897 8,908 882 5,506 (3,399)
Eliminate liabilities comprised in NOC:
- payables/ liabilities 10,434 2,603 2,790 1,601 3,440
- intercompany accounts − 54 95 68 (217)
- provisions 2,394 321 342 302 1,429
Include assets not comprised in NOC:
- investments in associates 181 76 1 18 86
- other current financial assets 6 − − − 6
- other non-current financial assets 479 − − − 479
- deferred tax assets 1,367 − − − 1,367
- liquid assets 5,832 − − − 5,832
32,590 11,962 4,110 7,495 9,023
Assets classified as held for sale 120
Total assets 32,710