Philips 2012 Annual Report Download - page 73
Download and view the complete annual report
Please find page 73 of the 2012 Philips annual report below. You can navigate through the pages in the report by either clicking on the pages listed below, or by using the keyword search tool below to find specific information within the annual report.-
 1
1 -
2
-
3
-
4
-
5
-
6
-
7
-
8
-
9
-
10
-
11
-
12
-
13
-
14
-
15
-
16
-
17
-
18
-
19
-
20
-
21
-
22
-
23
-
24
-
25
-
26
-
27
-
28
-
29
-
30
-
31
-
32
-
33
-
34
-
35
-
36
-
37
-
38
-
39
-
40
-
41
-
42
-
43
-
44
-
45
-
46
-
47
-
48
-
49
-
50
-
51
-
52
-
53
-
54
-
55
-
56
-
57
-
58
-
59
-
60
-
61
-
62
-
 63
63 -
 64
64 -
 65
65 -
 66
66 -
 67
67 -
 68
68 -
 69
69 -
 70
70 -
 71
71 -
 72
72 -
 73
73 -
 74
74 -
 75
75 -
 76
76 -
 77
77 -
 78
78 -
 79
79 -
 80
80 -
 81
81 -
 82
82 -
 83
83 -
84
-
85
-
86
-
87
-
88
-
89
-
90
-
91
-
92
-
93
-
94
-
95
-
96
-
97
-
98
-
99
-
100
-
101
-
102
-
103
-
104
-
105
-
106
-
107
-
108
-
109
-
110
-
111
-
112
-
113
-
114
-
115
-
116
-
117
-
118
-
119
-
120
-
121
-
122
-
123
-
124
-
125
-
126
-
127
-
128
-
129
-
130
-
131
-
132
-
133
-
134
-
135
-
136
-
137
-
138
-
139
-
140
-
141
-
142
-
143
-
144
-
145
-
146
-
147
-
148
-
149
-
150
-
151
-
152
-
153
-
154
-
155
-
156
-
157
-
158
-
159
-
160
-
161
-
162
-
163
-
164
-
165
-
166
-
167
-
168
-
169
-
170
-
171
-
172
-
173
-
174
-
175
-
176
-
177
-
178
-
179
-
180
-
181
-
182
-
183
-
184
-
185
-
186
-
187
-
188
-
189
-
190
-
191
-
192
-
193
-
194
-
195
-
196
-
197
-
198
-
199
-
200
-
201
-
202
-
203
-
204
-
205
-
206
-
207
-
208
-
209
-
210
-
211
-
212
-
213
-
214
-
215
-
216
-
217
-
218
-
219
-
220
-
221
-
222
-
223
-
224
-
225
-
226
-
227
-
228
-
229
-
230
-
231
 |
 |

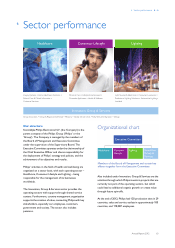
6 Sector performance 6.2.4 - 6.2.5
Annual Report 2012 73
brominated flame retardants (BFR) from our products,
and for the first time all of our espresso coffee machines
launched during the year are free of these substances.
We increased the use of recycled materials in our
products. For example, the housing base of the Performer
range of vacuum cleaners is now made from recycled
plastics, resulting in the use of approximately 300 tonnes
of recycled plastic by 2013.
6.2.5 2012 financial performance
Key data
in millions of euros unless otherwise stated
2010 2011 2012
Sales 5,504 5,615 5,953
Sales growth
% increase (decrease), nominal 7 2 6
% increase (decrease), comparable1) − 1 2
EBITA1) 487 297 663
as a % of sales 8.8 5.3 11.1
EBIT 449 217 593
as a % of sales 8.2 3.9 10.0
Net operating capital (NOC)1) 882 884 1,217
Cash flows before financing activities1) 288 (257) 597
Employees (FTEs) 14,095 18,291 18,911
1) For a reconciliation to the most directly comparable GAAP measures, see
chapter 15, Reconciliation of non-GAAP information, of this Annual Report
Sales amounted to EUR 5,953 million, a nominal increase
of 6% compared to 2011, mainly driven by double-digit
growth in our Health & Wellness and Domestic
Appliances businesses. This was partly offset by a double-
digit decline in Lifestyle Entertainment, where growth was
adversely affected by a slowdown in consumer spending,
particularly in mature geographies. Excluding a 3%
favorable currency impact and a 1% impact from portfolio
changes, comparable sales were 2% higher than the
previous year.
From a geographical perspective, we recorded 7%
comparable sales growth in growth geographies, which
was partly offset by a 2% decline in mature geographies,
mainly in Western Europe. In growth geographies, the
year-on-year sales increase was driven by Russia and
China, primarily in our Domestic Appliances and Personal
Care businesses. Growth geographies’ share of sector
sales increased from 42% in 2011 to 46% in 2012.
EBITA increased from EUR 297 million, or 5.3% of sales,
in 2011 to EUR 663 million, or 11.1% of sales, in 2012.
Restructuring and acquisition-related charges amounted
to EUR 75 million in 2012, compared to EUR 54 million
in 2011. 2012 results included a EUR 160 million one-
time gain from the extension of our partnership with Sara
Lee, including the transfer of our 50% ownership right to
the Senseo trademark. Excluding this one-time gain, the
year-on-year EBITA increase was driven by higher sales
across all growth businesses as well as lower net costs
formerly reported as part of the Television business.
Compared to 2011, EBITA improvements were seen in
all businesses.
EBIT amounted to EUR 593 million, or 10.0% of sales,
which included EUR 70 million of amortization charges,
mainly related to intangible assets in Health & Wellness
and Domestic Appliances.
Net operating capital increased from EUR 884 million in
2011 to EUR 1,217 million in 2012, primarily due to a
reduction in the accounts payable balance related to the
former Television business in Consumer Lifestyle.
Cash flows before financing activities increased from a
cash outflow of EUR 257 million in 2011 to a cash inflow of
EUR 597 million. The increase was attributable to higher
cash earnings, lower cash outflows for acquisitions as well
as the transfer of our 50% ownership right to the Senseo
trademark to Sara Lee for cash proceeds EUR 170 million.
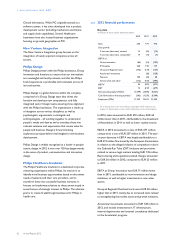
Sales per geographic cluster
in millions of euros
■-Western Europe_■-North America_■-other mature_■-growth
7,000
3,500
0
2008
2,383
1,210
199
2,149
5,941
2009
2,152
976
194
1,832
5,154
2010
2,098
1,031
235
2,140
5,504
2011
2,009
989
263
2,354
5,615
2012
1,844
1,062
322
2,725
5,953
Sales and net operating capital
in billions of euros ■-Sales----NOC
8
4
0
0.8
5.9
2008
0.6
5.2
2009
0.9
5.5
2010
0.9
5.6
2011
1.2
6.0
2012