Philips 2012 Annual Report Download - page 151
Download and view the complete annual report
Please find page 151 of the 2012 Philips annual report below. You can navigate through the pages in the report by either clicking on the pages listed below, or by using the keyword search tool below to find specific information within the annual report.-
 1
1 -
2
-
3
-
4
-
5
-
6
-
7
-
8
-
9
-
10
-
11
-
12
-
13
-
14
-
15
-
16
-
17
-
18
-
19
-
20
-
21
-
22
-
23
-
24
-
25
-
26
-
27
-
28
-
29
-
30
-
31
-
32
-
33
-
34
-
35
-
36
-
37
-
38
-
39
-
40
-
41
-
42
-
43
-
44
-
45
-
46
-
47
-
48
-
49
-
50
-
51
-
52
-
53
-
54
-
55
-
56
-
57
-
58
-
59
-
60
-
61
-
62
-
63
-
64
-
65
-
66
-
67
-
68
-
69
-
70
-
71
-
72
-
73
-
74
-
75
-
76
-
77
-
78
-
79
-
80
-
81
-
82
-
83
-
84
-
85
-
86
-
87
-
88
-
89
-
90
-
91
-
92
-
93
-
94
-
95
-
96
-
97
-
98
-
99
-
100
-
101
-
102
-
103
-
104
-
105
-
106
-
107
-
108
-
109
-
110
-
111
-
112
-
113
-
114
-
115
-
116
-
117
-
118
-
119
-
120
-
121
-
122
-
123
-
124
-
125
-
126
-
127
-
128
-
129
-
130
-
131
-
132
-
133
-
134
-
135
-
136
-
137
-
138
-
139
-
140
-
 141
141 -
 142
142 -
 143
143 -
 144
144 -
 145
145 -
 146
146 -
 147
147 -
 148
148 -
 149
149 -
 150
150 -
 151
151 -
 152
152 -
 153
153 -
 154
154 -
 155
155 -
 156
156 -
 157
157 -
 158
158 -
 159
159 -
 160
160 -
 161
161 -
162
-
163
-
164
-
165
-
166
-
167
-
168
-
169
-
170
-
171
-
172
-
173
-
174
-
175
-
176
-
177
-
178
-
179
-
180
-
181
-
182
-
183
-
184
-
185
-
186
-
187
-
188
-
189
-
190
-
191
-
192
-
193
-
194
-
195
-
196
-
197
-
198
-
199
-
200
-
201
-
202
-
203
-
204
-
205
-
206
-
207
-
208
-
209
-
210
-
211
-
212
-
213
-
214
-
215
-
216
-
217
-
218
-
219
-
220
-
221
-
222
-
223
-
224
-
225
-
226
-
227
-
228
-
229
-
230
-
231
 |
 |

12 Group financial statements 12.11 - 12.11 11
Annual Report 2012 151
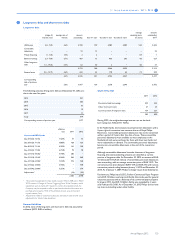
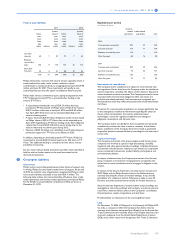
other intangible
assets
product
development software total
Balance as of
January 1, 2011:
Cost 5,486 1,271 440 7,197
Amortization/
impairments (1,956) (708) (335) (2,999)
Book value 3,530 563 105 4,198
Changes in
book value:
Additions 31 292 40 363
Acquisitions
and purchase
price allocation
adjustments 242 (1) (1) 240
Amortization/
deductions (444) (172) (53) (669)
Impairment
losses (153) (15) (2) (170)
Transfer to
assets classified
as held for sale (8) (26) 1 (33)
Translation
differences 72 16 1 89
Other (6) (14) (2) (22)
Total changes (266) 80 (16) (202)
Balance as of
December 31,
2011:
Cost 5,857 1,437 369 7,663
Amortization/
impairments (2,593) (793) (281) (3,667)
Book value 3,264 644 88 3,996
The additions for 2012 contain internally generated assets of EUR 347
million and EUR 29 million for product development and software
respectively (2011: EUR 292 million, EUR 40 million).
The acquisitions through business combinations in 2012 mainly consist
of the acquired intangibles assets of Indal for EUR 134 million. The
acquisistions in 2011 mainly consist of the acquired intangible assets of
Povos for EUR 138 million, Preethi EUR 69 million and Sectra EUR 22
million.
The amortization of intangible assets is specified in note 1, Income from
operations.
The impairment charges in 2012 for other intangibles mainly relates to
brand names in Professional Lighting Solutions. As part of the
rationalization of the go-to-market model in Professional Lighting
Solutions, the Company decided to discontinue the use of several
brands which resulted in the mentioned impairment charge. The
impairment of product development of EUR 30 million relates to
various projects in all three operating sectors.
Other intangible assets consist of:
December 31,
2011
December 31,
2012
gross
amortization/
impairments gross
amortization/
impairments
Brand names 966 (301) 966 (374)
Customer
relationships 3,114 (1,165) 3,045 (1,318)
Technology 1,699 (1,072) 1,759 (1,202)
Other 78 (55) 98 (78)
5,857 (2,593) 5,868 (2,972)
The estimated amortization expense for other intangible assets for each
of the next five years is:
2013 380
2014 327
2015 298
2016 264
2017 238
The expected useful lives of the intangible assets excluding goodwill are
as follows:
Brand names 2-20 years
Customer relationships 2-25 years
Technology 3-20 years
Other 1-8 years
Software 3 years
Development 3-5 years
The expected weighted average remaining life of other intangible assets
is 11.2 years as of December 31, 2012 (2011: 11.4 years).
The Group reviewed the useful lives of the intangible assets, resulting
in no material changes.
The unamortized costs of development costs amounted to EUR 361
million (2011: EUR 201 million).
11 Non-current receivables
Non-current receivables include receivables with a remaining term of
more than one year.