Philips 2012 Annual Report Download - page 192
Download and view the complete annual report
Please find page 192 of the 2012 Philips annual report below. You can navigate through the pages in the report by either clicking on the pages listed below, or by using the keyword search tool below to find specific information within the annual report.-
 1
1 -
2
-
3
-
4
-
5
-
6
-
7
-
8
-
9
-
10
-
11
-
12
-
13
-
14
-
15
-
16
-
17
-
18
-
19
-
20
-
21
-
22
-
23
-
24
-
25
-
26
-
27
-
28
-
29
-
30
-
31
-
32
-
33
-
34
-
35
-
36
-
37
-
38
-
39
-
40
-
41
-
42
-
43
-
44
-
45
-
46
-
47
-
48
-
49
-
50
-
51
-
52
-
53
-
54
-
55
-
56
-
57
-
58
-
59
-
60
-
61
-
62
-
63
-
64
-
65
-
66
-
67
-
68
-
69
-
70
-
71
-
72
-
73
-
74
-
75
-
76
-
77
-
78
-
79
-
80
-
81
-
82
-
83
-
84
-
85
-
86
-
87
-
88
-
89
-
90
-
91
-
92
-
93
-
94
-
95
-
96
-
97
-
98
-
99
-
100
-
101
-
102
-
103
-
104
-
105
-
106
-
107
-
108
-
109
-
110
-
111
-
112
-
113
-
114
-
115
-
116
-
117
-
118
-
119
-
120
-
121
-
122
-
123
-
124
-
125
-
126
-
127
-
128
-
129
-
130
-
131
-
132
-
133
-
134
-
135
-
136
-
137
-
138
-
139
-
140
-
141
-
142
-
143
-
144
-
145
-
146
-
147
-
148
-
149
-
150
-
151
-
152
-
153
-
154
-
155
-
156
-
157
-
158
-
159
-
160
-
161
-
162
-
163
-
164
-
165
-
166
-
167
-
168
-
169
-
170
-
171
-
172
-
173
-
174
-
175
-
176
-
177
-
178
-
179
-
180
-
181
-
 182
182 -
 183
183 -
 184
184 -
 185
185 -
 186
186 -
 187
187 -
 188
188 -
 189
189 -
 190
190 -
 191
191 -
 192
192 -
 193
193 -
 194
194 -
 195
195 -
 196
196 -
 197
197 -
 198
198 -
 199
199 -
 200
200 -
 201
201 -
 202
202 -
203
-
204
-
205
-
206
-
207
-
208
-
209
-
210
-
211
-
212
-
213
-
214
-
215
-
216
-
217
-
218
-
219
-
220
-
221
-
222
-
223
-
224
-
225
-
226
-
227
-
228
-
229
-
230
-
231
 |
 |

14 Sustainability statements 14.3 - 14.3
192 Annual Report 2012
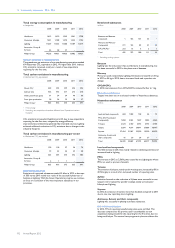
Total energy consumption in manufacturing
in terajoules
2008 2009 2010 2011 2012
Healthcare 1,612 1,670 1,545 1,541 1,798
Consumer Lifestyle 1,521 1,188 1,274 1,252 1,104
Lighting 11,359 11,535 11,580 11,189 11,519
Innovation, Group &
Services 34 28 27 − −
Philips Group 14,526 14,421 14,426 13,982 14,421
Carbon emissions in manufacturing
The greenhouse gas emissions of our manufacturing operations totaled
691 kilotonnes CO2-equivalent in 2012, 9% higher than 2011. Indirect
CO2 emissions increased, mainly as a result of new acquisitions
reporting for the first time.
Total carbon emissions in manufacturing
in kilotonnes CO2-equivalent
2008 2009 2010 2011 2012
Direct CO21) 300 295 299 294 294
Indirect CO2436 443 317 273 310
Other greenhouse gases 61 54 34 40 60
From glass production 28 24 25 28 27
Philips Group2) 825 816 675 635 691
1) From energy
2) Excluding new acquisitions therefore different from Operational carbon
footprint
CO2 emissions increased at Healthcare and CL due to new acquisitions
reporting for the first time, mitigated by energy efficiency
improvements and electricity generated by renewable sources. Lighting
achieved additional reductions in CO2 emissions due to changes in the
industrial footprint.
Total carbon emissions in manufacturing per sector
in kilotonnes CO2-equivalent
2008 2009 2010 2011 2012
Healthcare 120 118 57 54 70
Consumer Lifestyle 70 53 42 39 38
Lighting 633 644 575 542 583
Innovation, Group &
Services 2 1 1 − −
Philips Group 825 816 675 635 691
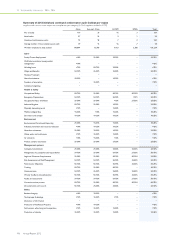
Restricted substances
Emissions of restricted substances totaled 55 kilos in 2012, a decrease
of 50% versus 2011 mainly as a result of the successful phase-out of
benzene in Lighting. With the Green Operations program we continue
to focus on a selection of the most important substances in our
processes.
Restricted substances
in kilos
2008 2009 2010 2011 2012
Benzene and Benzene
compounds 1 136 101 55 −
Mercury and Mercury
Compounds 211 122 83 51 54
CFCs/HCFCs1) 213 14 4 5 1
Total 425 272 188 111 55
1) Excluding cooling systems
Benzene
Lighting was the only sector that used benzene in manufacturing, but
has been successful in 2012 in the phase-out of benzene.
Mercury
Mercury is used exclusively by Lighting. Emissions increased from 51 kg
in 2011 to 54 kg in 2012, due to increased loads and a product mix
change.
CFCs/HCFCs
In 2012 total emissions from CFCs/HCFCs reduced further to 1 kg.
Hazardous substances
Targets have been set on a selected number of hazardous substances.
Hazardous substances
in kilos
2008 2009 2010 2011 2012
Lead and lead compounds 684 1,958 108 44 73
PFCs (Per Fluorinated
Compounds) 1,858 2,535 1,507 1,842 2,560
Toluene 2,524 2,160 6,745 5,745 6,184
Xylene 3,684 4,619 30,491 37,889 18,947
Styrene 37,454 21,567 22,920 19,920 42,329
Antimony, Arsenic and
their compounds 16 30 24 37 −
Total 46,220 32,869 61,795 65,477 70,093
Lead and lead compounds
The 66% increase in 2012 was mainly related to soldering activities and
increased load in Lighting.
PFCs
The increase in 2012 to 2,560 kg was caused by one Lighting site where
PFCs are used as process chemicals.
Toluene
The emission of toluene, mainly used in wet lacquers, increased by 8% in
2012 largely as a result of an increased number of reporting sites.
Xylene
Activities focused on the reduction of Xylene were successful as wet
lacquers were replaced by powder coatings mainly at Consumer
Lifestyle and Lighting.
Styrene
In 2012, the emission of styrene more than doubled compared to 2011
due to one new reporting site in Lighting.
Antimony, Arsenic and their compounds
Lighting was successful in phasing-out these substances.
ISO 14001 certification
In 2012, 71% of reporting manufacturing sites were certified. This
decrease compared to the previous year is attributable to new
acquisitions being included in the reporting for the first time, but not
being certified yet. The sectors have programs in place to address this.