Philips 2012 Annual Report Download - page 191
Download and view the complete annual report
Please find page 191 of the 2012 Philips annual report below. You can navigate through the pages in the report by either clicking on the pages listed below, or by using the keyword search tool below to find specific information within the annual report.-
 1
1 -
2
-
3
-
4
-
5
-
6
-
7
-
8
-
9
-
10
-
11
-
12
-
13
-
14
-
15
-
16
-
17
-
18
-
19
-
20
-
21
-
22
-
23
-
24
-
25
-
26
-
27
-
28
-
29
-
30
-
31
-
32
-
33
-
34
-
35
-
36
-
37
-
38
-
39
-
40
-
41
-
42
-
43
-
44
-
45
-
46
-
47
-
48
-
49
-
50
-
51
-
52
-
53
-
54
-
55
-
56
-
57
-
58
-
59
-
60
-
61
-
62
-
63
-
64
-
65
-
66
-
67
-
68
-
69
-
70
-
71
-
72
-
73
-
74
-
75
-
76
-
77
-
78
-
79
-
80
-
81
-
82
-
83
-
84
-
85
-
86
-
87
-
88
-
89
-
90
-
91
-
92
-
93
-
94
-
95
-
96
-
97
-
98
-
99
-
100
-
101
-
102
-
103
-
104
-
105
-
106
-
107
-
108
-
109
-
110
-
111
-
112
-
113
-
114
-
115
-
116
-
117
-
118
-
119
-
120
-
121
-
122
-
123
-
124
-
125
-
126
-
127
-
128
-
129
-
130
-
131
-
132
-
133
-
134
-
135
-
136
-
137
-
138
-
139
-
140
-
141
-
142
-
143
-
144
-
145
-
146
-
147
-
148
-
149
-
150
-
151
-
152
-
153
-
154
-
155
-
156
-
157
-
158
-
159
-
160
-
161
-
162
-
163
-
164
-
165
-
166
-
167
-
168
-
169
-
170
-
171
-
172
-
173
-
174
-
175
-
176
-
177
-
178
-
179
-
180
-
 181
181 -
 182
182 -
 183
183 -
 184
184 -
 185
185 -
 186
186 -
 187
187 -
 188
188 -
 189
189 -
 190
190 -
 191
191 -
 192
192 -
 193
193 -
 194
194 -
 195
195 -
 196
196 -
 197
197 -
 198
198 -
 199
199 -
 200
200 -
 201
201 -
202
-
203
-
204
-
205
-
206
-
207
-
208
-
209
-
210
-
211
-
212
-
213
-
214
-
215
-
216
-
217
-
218
-
219
-
220
-
221
-
222
-
223
-
224
-
225
-
226
-
227
-
228
-
229
-
230
-
231
 |
 |

14 Sustainability statements 14.1 - 14.3
Annual Report 2012 191
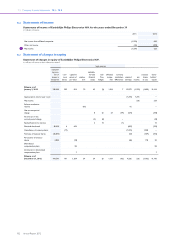
Total purchased goods and services amounted to EUR 15.4 billion,
representing 62% of total revenues of the Philips Group. Of this
amount, 65% was spent with global suppliers, the remainder with local
suppliers. Compared to 2011, spending increased in absolute terms as a
result of higher sales volumes.
In 2012, the salaries and wages totaled EUR 6.0 billion. This amount is
EUR 851 million higher than in 2011, mainly caused by restructuring
costs. See note 1, Income from operations for more information.
Dividend distributed to shareholders amounted to EUR 687 million,
EUR 24 million down compared to 2011.
Corporate income taxes increased slightly to EUR 308 million in 2012
from EUR 283 million in 2011, mainly attributable to higher taxable
earnings. For a further understanding, see note 3, Income taxes.
14.2 EcoVision
Our latest EcoVision program, includes key performance indicators in
relation to Green Product sales, Improving people’s lives, Green
Innovation, Green Operations, Health & Safety, Employee Engagement
and Supplier Sustainability.
Improving people’s lives
Philips products and solutions that directly can support the curative or
preventive side of people’s health was one of the parameters of our
EcoVision 5 program, labelled ‘Bringing care to people’, with a target
of 500 million lives touched in 2015. In this category in 2012, we already
touched over 570 million lives, driven by our Healthcare sector.
With the renewal of our company vision in 2012 we have extended
that approach with our ‘well-being’ products that help people live a
healthy life as well as our Green Products and solutions of all sectors
that contribute to a healthy ecosystem. For the year 2012 we have
established our total baseline of 1.7 billion people a year.
Examples of product categories contributing to the ‘care’ category are
all healthcare products.
Examples of products in the ‘well-being’ category that help people live a
healthier life are juicers, blenders, air fryers, but also mother and
childcare products. Further details on this parameter and the
methodology can be found in the document ‘Improving people’s lives’.
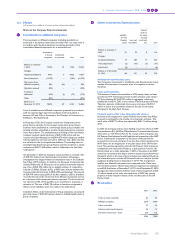
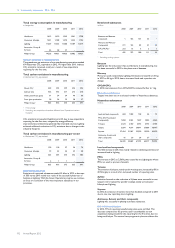
Operational carbon footprint and energy efficiency
Our operational carbon footprint decreased 9% in 2012.
Operational energy efficiency and carbon footprint: 2012
details
The 2012 results can be attributed to several factors:
• Accounting for 44% of the total footprint, total CO2 emissions from
manufacturing increased due to acquisitions which were largely
mitigated by continued energy efficiency improvement programs,
our changing industrial footprint and the further increase of the
share of purchased electricity from renewable sources to 47% of
total purchased electricity.
• CO2 emissions from non-industrial operations (offices, warehouses,
etc.) represent 9% of the total. The overall floor space decreased
marginally. However, CO2 emissions decreased 9% as we continued
to centralize and re-allocate existing facilities, focusing on the most
efficient use of facility space and increasing the share of purchased
electricity from renewable sources.
• The total CO2 emissions related to business travel, accounting for
13% of our carbon footprint, decreased 15%. Our stringent in-
house travel policy resulted in a significant decrease of CO2
emissions from air travel and rental cars. Furthermore, the fleet of
lease cars increased but the total CO2 emissions decreased.
• Overall CO2 emissions from logistics, representing approximately
one third of the total, decreased 17%. This decrease mainly resulted
from the exclusion of TV business. However, results can also be
attributed to an effective gatekeeping process to move freight from
air to sea, as well as our continued focus on optimizing container
utilization.
Operational carbon footprint for logistics
in kilotonnes CO2-equivalent
2008 2009 2010 2011 2012
Air transport 305 308 345 328 309
Road transport 211 174 160 176 105
Sea transport 190 145 167 153 132
Philips Group 706 627 672 657 546
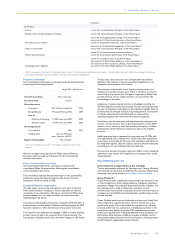
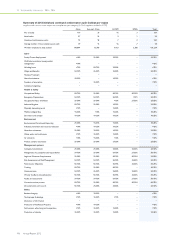
14.3 Green Operations
In 2010, we decided to group all activities related to improving the
environmental performance of our manufacturing facilities (including
chemicals management) under the Green Manufacturing 2015 program,
which we renamed to Green Operations. The program focuses on
most contributors to climate change, but also addresses water,
recycling of waste and chemical substances.
In the course of 2012 we implemented a new IT solution for our
environmental reporting, thereby further improving the data quality and
the accuracy of the reporting process. Next, we implemented a new
process to monitor chemicals used in processes in more detail. Since
Philips focuses its reduction efforts on the restricted and hazardous
substances listed below, we decided to exclude the categories ‘Other
restricted substances’ and ‘Other hazardous substances’ from our
reporting in 2012. Based on the new insights gained through the new
chemicals management process, we will define new reduction targets
in 2013 for some of those chemicals.
Green Operations
in % unless otherwise stated
2007
baseline year
2012
actual1) 2015 target1)
Total CO2 from manufacturing
865 kilotonnes CO2-
equivalent – 20 – 25
Water 4.2 million m3 15 – 10
Materials provided for
recycling via external
contractor per total waste 79 77 80
Restricted substances:
Benzene emission 52 kg – 100 achieved
Mercury emission 185 kg – 71 – 100
CFCs, HCFCs 156 kg – 100 achieved
Hazardous substances
Lead emission 1,838 kg – 96 – 100
PFCs 1,534 kg 67 – 35
Toluene emission 2,210 kg 180 – 90
Xylene emission 4,506 kg 320 – 90
Styrene 80,526 kg – 47 – 90
Antimony, Arsenic and their
compounds 18 kg – 99 – 100
1) Against the base year 2007
Energy use in manufacturing
Total energy usage in manufacturing amounted to 14,421 terajoules in
2012, of which Lighting consumes about 80%. Compared to 2011,
energy consumption at Philips went up by 3%. This was driven by new
acquisitions reporting for the first time, organizational changes and
energy efficiency improvements.