Philips 2012 Annual Report Download - page 5
Download and view the complete annual report
Please find page 5 of the 2012 Philips annual report below. You can navigate through the pages in the report by either clicking on the pages listed below, or by using the keyword search tool below to find specific information within the annual report.-
 1
1 -
 2
2 -
 3
3 -
 4
4 -
 5
5 -
 6
6 -
 7
7 -
 8
8 -
 9
9 -
 10
10 -
 11
11 -
 12
12 -
 13
13 -
 14
14 -
 15
15 -
 16
16 -
17
-
18
-
19
-
20
-
21
-
22
-
23
-
24
-
25
-
26
-
27
-
28
-
29
-
30
-
31
-
32
-
33
-
34
-
35
-
36
-
37
-
38
-
39
-
40
-
41
-
42
-
43
-
44
-
45
-
46
-
47
-
48
-
49
-
50
-
51
-
52
-
53
-
54
-
55
-
56
-
57
-
58
-
59
-
60
-
61
-
62
-
63
-
64
-
65
-
66
-
67
-
68
-
69
-
70
-
71
-
72
-
73
-
74
-
75
-
76
-
77
-
78
-
79
-
80
-
81
-
82
-
83
-
84
-
85
-
86
-
87
-
88
-
89
-
90
-
91
-
92
-
93
-
94
-
95
-
96
-
97
-
98
-
99
-
100
-
101
-
102
-
103
-
104
-
105
-
106
-
107
-
108
-
109
-
110
-
111
-
112
-
113
-
114
-
115
-
116
-
117
-
118
-
119
-
120
-
121
-
122
-
123
-
124
-
125
-
126
-
127
-
128
-
129
-
130
-
131
-
132
-
133
-
134
-
135
-
136
-
137
-
138
-
139
-
140
-
141
-
142
-
143
-
144
-
145
-
146
-
147
-
148
-
149
-
150
-
151
-
152
-
153
-
154
-
155
-
156
-
157
-
158
-
159
-
160
-
161
-
162
-
163
-
164
-
165
-
166
-
167
-
168
-
169
-
170
-
171
-
172
-
173
-
174
-
175
-
176
-
177
-
178
-
179
-
180
-
181
-
182
-
183
-
184
-
185
-
186
-
187
-
188
-
189
-
190
-
191
-
192
-
193
-
194
-
195
-
196
-
197
-
198
-
199
-
200
-
201
-
202
-
203
-
204
-
205
-
206
-
207
-
208
-
209
-
210
-
211
-
212
-
213
-
214
-
215
-
216
-
217
-
218
-
219
-
220
-
221
-
222
-
223
-
224
-
225
-
226
-
227
-
228
-
229
-
230
-
231
 |
 |

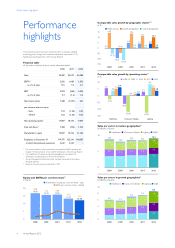
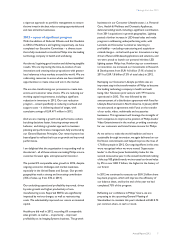
Performance highlights
Annual Report 2012 5
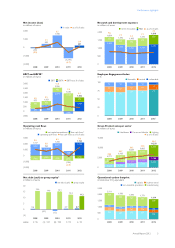
Net income (loss)
in millions of euros ■-in value----as a % of sales
2,000
1,000
0
(1,000)
(2,000)
(0.5)
(99)
2008
2.1
430
2009
6.5
1,448
2010
(5.7)
(1,291)
2011
0.9
231
2012
EBIT and EBITA1)
in millions of euros
■-EBIT--■
■-EBITA----EBITA as a % of sales
3,000
2,500
2,000
1,500
1,000
500
0
(500)
287
690
977
4.5
2008
667
436
1,103
5.5
2009
2,074
482
2,556
11.5
2010
(269)
1,949
1,680
7.4
2011
1,030
472
1,502
6.1
2012
Operating cash flows
in millions of euros
■-net capital expenditures_■
■-free cash flows1)
■-operating cash flows_--free cash flows as a % of sales
3,000
2,000
1,000
0
(1,000)
(2,000)
1,883
(766)
1,117
5.2
2008
1,354
(590)
764
3.8
2009
2,074
(716)
1,358
6.1
2010
768
(872)
(104)
(0.5)
2011
2,198
(475)
1,723
7.0
2012
Net debt (cash) to group equity1)
in billions of euros ■-net debt (cash)--■-group equity
20
15
10
5
0
(5)
0.6
15.6
4 : 96
2008
(0.1)
14.6
(1) : 101
2009
(1.2)
15.1
(8) : 108
2010
0.7
12.4
5 : 95
2011
0.7
11.2
6 : 94
2012
ratio:
Research and development expenses
in millions of euros
■-Green Innovation_■
■-R&D_-- as a % of sales
2,000
1,500
1,000
500
0
1,409
275
1,684
7.8
2008
1,202
340
1,542
7.7
2009
1,101
392
1,493
6.7
2010
1,131
479
1,610
7.1
2011
1,241
569
1,810
7.3
2012
Employee Engagement Index
in % ■-favorable--■-neutral--■-unfavorable
100
75
50
25
0
2008
72
16
12
2009
71
15
14
2010
77
12
11
2011
76
14
10
20124)
79
15 6
Green Product sales per sector
in millions of euros
■-Healthcare_■-Consumer Lifestyle _■-Lighting
--as a % of sales
15,000
10,000
5,000
0
2008
1,527
274
2,970
4,771
22.0
2009
1,791
979
3,393
6,163
30.7
2010
2,136
1,557
4,376
8,069
36.2
2011
2,663
1,571
4,571
8,805
39.0
2012
3,610
1,888
5,752
11,250
45.4
Operational carbon footprint
in kilotonnes CO2-equivalent ■-logistics_■-business travel
■-non-industrial operations_■-manufacturing
2,500
2,000
1,500
1,000
500
0
2008
706
265
181
959
2,111
2009
627
220
174
909
1,930
2010
672
247
159
767
1,845
2011
657
256
155
703
1,771
2012
546
217
142
709
1,614