Philips 2012 Annual Report Download - page 140
Download and view the complete annual report
Please find page 140 of the 2012 Philips annual report below. You can navigate through the pages in the report by either clicking on the pages listed below, or by using the keyword search tool below to find specific information within the annual report.-
 1
1 -
2
-
3
-
4
-
5
-
6
-
7
-
8
-
9
-
10
-
11
-
12
-
13
-
14
-
15
-
16
-
17
-
18
-
19
-
20
-
21
-
22
-
23
-
24
-
25
-
26
-
27
-
28
-
29
-
30
-
31
-
32
-
33
-
34
-
35
-
36
-
37
-
38
-
39
-
40
-
41
-
42
-
43
-
44
-
45
-
46
-
47
-
48
-
49
-
50
-
51
-
52
-
53
-
54
-
55
-
56
-
57
-
58
-
59
-
60
-
61
-
62
-
63
-
64
-
65
-
66
-
67
-
68
-
69
-
70
-
71
-
72
-
73
-
74
-
75
-
76
-
77
-
78
-
79
-
80
-
81
-
82
-
83
-
84
-
85
-
86
-
87
-
88
-
89
-
90
-
91
-
92
-
93
-
94
-
95
-
96
-
97
-
98
-
99
-
100
-
101
-
102
-
103
-
104
-
105
-
106
-
107
-
108
-
109
-
110
-
111
-
112
-
113
-
114
-
115
-
116
-
117
-
118
-
119
-
120
-
121
-
122
-
123
-
124
-
125
-
126
-
127
-
128
-
129
-
 130
130 -
 131
131 -
 132
132 -
 133
133 -
 134
134 -
 135
135 -
 136
136 -
 137
137 -
 138
138 -
 139
139 -
 140
140 -
 141
141 -
 142
142 -
 143
143 -
 144
144 -
 145
145 -
 146
146 -
 147
147 -
 148
148 -
 149
149 -
 150
150 -
151
-
152
-
153
-
154
-
155
-
156
-
157
-
158
-
159
-
160
-
161
-
162
-
163
-
164
-
165
-
166
-
167
-
168
-
169
-
170
-
171
-
172
-
173
-
174
-
175
-
176
-
177
-
178
-
179
-
180
-
181
-
182
-
183
-
184
-
185
-
186
-
187
-
188
-
189
-
190
-
191
-
192
-
193
-
194
-
195
-
196
-
197
-
198
-
199
-
200
-
201
-
202
-
203
-
204
-
205
-
206
-
207
-
208
-
209
-
210
-
211
-
212
-
213
-
214
-
215
-
216
-
217
-
218
-
219
-
220
-
221
-
222
-
223
-
224
-
225
-
226
-
227
-
228
-
229
-
230
-
231
 |
 |

2 12 Group financial statements 12.11 - 12.11
140 Annual Report 2012
Audit fees
Fees KPMG
2010 2011 2012
Audit fees 16.4 15.6 14.7
- consolidated financial statements 10.6 10.1 9.7
- statutory financial statements 5.8 5.5 5.0
Audit-related fees1) 2.6 2.4 5.6
- acquisitions and divestments 1.0 0.1 2.9
- sustainability assurance 0.3 0.5 0.8
- other 1.3 1.8 1.9
Tax fees2) 0.4 0.9 1.3
-tax compliance services 0.4 0.9 1.3
Other fees3) 1.0 0.5 0.7
- royalty investigation 0.4 0.4 0.1
- other 0.6 0.1 0.6
Total 20.4 19.4 22.3
1) The percentage of services provided in 2012 is 25.1% of the total fees
2) The percentage of services provided in 2012 is 5.8% of the total fees
3) The percentage of services provided in 2012 is 3.1% of the total fees
This table ’Fees KPMG’ forms an integral part of the Company Financial
Statements, please refer to note J, Audit fees.
Impairment of goodwill
In 2011, goodwill has been impaired in the Healthcare sector for an
amount of EUR 824 million and in the Lighting sector for an amount of
EUR 531 million. For further information on impairment of goodwill,
see note 9, Goodwill.
Other business income (expenses)
Other business income (expenses) consists of the following:
2010 2011 2012
Result on disposal of businesses:
- income 9 28 30
- expense (10) (26) (85)
Result on disposal of fixed assets:
- income 49 47 225
- expense (9) (11) (9)
Result on other remaining businesses:
- income 35 50 42
- expense (8) (38) (506)
66 50 (303)
Total other business income 93 125 297
Total other business expense (27) (75) (600)
In 2012, results on disposal of business was mainly due to sale of
industrial sites.
In 2012, results of disposal of fixed assets was mainly due to the transfer
of its 50% ownership of Senseo trademark to Sara Lee and sale of real
estate assets of the High Tech Campus in Eindhoven, The Netherlands.
For further information, see note 5, Discontinued operations and other
assets classified as held for sale and note 7, Acquisitions and divestments
In 2012, results on other remaining business were mainly due to non-
core revenue and the European Commission fine, related to alleged
violation of competition rules in the Cathode-Ray Tubes (CRT)
industry, and various legal matters. For further information, see
note 25, Contingent liabilities.
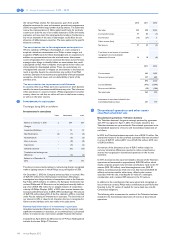
2Financial income and expenses
2010 2011 2012
Interest income 40 38 37
Interest income from loans and receivables 17 4 9
Interest income from cash and cash
equivalents 23 34 28
Dividend income from available for sale
financial assets 6 11 4
Net gains from disposal of financial assets 162 51 1
Net change in fair value of financial assets
at fair value through profit or loss − 6 −
Net change in fair value of financial
liabilities at fair value through profit or loss − − 44
Net foreign exchange gains 1 − −
Other finance income 5 6 20
Finance income 214 112 106
Interest expense (265) (248) (278)
Interest on debts and borrowings (263) (245) (271)
Finance charges under finance lease
contract (2) (3) (7)
Unwind of discount of provisions (20) (33) (22)
Net foreign exchange losses − (2) −
Impairment loss of financial assets (2) (34) (8)
Net change in fair value of financial assets
at fair value through profit or loss (21) − (2)
Other finance expenses (27) (35) (42)
Finance expense (335) (352) (352)
Financial income and expenses (121) (240) (246)
Net financial income and expense showed a EUR 246 million expense
in 2012, which was EUR 6 million higher than in 2011. Total finance
income of EUR 106 million included a EUR 46 million gain related to a
change in estimate on the valuation of long term derivative contracts.
Other finance income was EUR 20 million. Total finance expense of
EUR 352 million included EUR 8 million impairment charges. Other
financial expense consisted of EUR 22 million of accretion expenses
mainly associated with discounted provisions and uncertain tax
positions and EUR 42 million other financing charges.
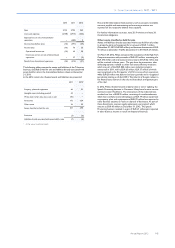
Net financial income and expense showed a EUR 240 million expense
in 2011, which was EUR 119 million higher than in 2010. Total finance
income of EUR 112 million included EUR 51 million gain on the disposal
of financial assets, of which EUR 44 million resulted from the sale of
shares in TCL and EUR 6 million resulted from the sale of Digimarc.
Remaining financial income included dividend income of EUR 11 million
and a total net EUR 6 million gain from fair value changes, mainly the
revaluation of the NXP option. Total finance expense of EUR 352
million included EUR 34 million impairment charges, mainly related to
the shareholding in TPV Technology. Other financial expense consisted
of EUR 33 million of accretion expenses mainly associated with
discounted provisions and uncertain tax positions and EUR 35 million
other financing charges.
Net financial income and expense showed a EUR 121 million expense
in 2010, which was EUR 41 million lower than in 2009. Total finance
income of EUR 214 million included EUR 162 million gain on the
disposal of financial assets, of which EUR 154 million resulted from the
sale of shares in NXP (please refer to note 12, Other non-current