Philips 2012 Annual Report Download - page 36
Download and view the complete annual report
Please find page 36 of the 2012 Philips annual report below. You can navigate through the pages in the report by either clicking on the pages listed below, or by using the keyword search tool below to find specific information within the annual report.-
 1
1 -
2
-
3
-
4
-
5
-
6
-
7
-
8
-
9
-
10
-
11
-
12
-
13
-
14
-
15
-
16
-
17
-
18
-
19
-
20
-
21
-
22
-
23
-
24
-
25
-
 26
26 -
 27
27 -
 28
28 -
 29
29 -
 30
30 -
 31
31 -
 32
32 -
 33
33 -
 34
34 -
 35
35 -
 36
36 -
 37
37 -
 38
38 -
 39
39 -
 40
40 -
 41
41 -
 42
42 -
 43
43 -
 44
44 -
 45
45 -
 46
46 -
47
-
48
-
49
-
50
-
51
-
52
-
53
-
54
-
55
-
56
-
57
-
58
-
59
-
60
-
61
-
62
-
63
-
64
-
65
-
66
-
67
-
68
-
69
-
70
-
71
-
72
-
73
-
74
-
75
-
76
-
77
-
78
-
79
-
80
-
81
-
82
-
83
-
84
-
85
-
86
-
87
-
88
-
89
-
90
-
91
-
92
-
93
-
94
-
95
-
96
-
97
-
98
-
99
-
100
-
101
-
102
-
103
-
104
-
105
-
106
-
107
-
108
-
109
-
110
-
111
-
112
-
113
-
114
-
115
-
116
-
117
-
118
-
119
-
120
-
121
-
122
-
123
-
124
-
125
-
126
-
127
-
128
-
129
-
130
-
131
-
132
-
133
-
134
-
135
-
136
-
137
-
138
-
139
-
140
-
141
-
142
-
143
-
144
-
145
-
146
-
147
-
148
-
149
-
150
-
151
-
152
-
153
-
154
-
155
-
156
-
157
-
158
-
159
-
160
-
161
-
162
-
163
-
164
-
165
-
166
-
167
-
168
-
169
-
170
-
171
-
172
-
173
-
174
-
175
-
176
-
177
-
178
-
179
-
180
-
181
-
182
-
183
-
184
-
185
-
186
-
187
-
188
-
189
-
190
-
191
-
192
-
193
-
194
-
195
-
196
-
197
-
198
-
199
-
200
-
201
-
202
-
203
-
204
-
205
-
206
-
207
-
208
-
209
-
210
-
211
-
212
-
213
-
214
-
215
-
216
-
217
-
218
-
219
-
220
-
221
-
222
-
223
-
224
-
225
-
226
-
227
-
228
-
229
-
230
-
231
 |
 |

5 Group performance 5.1.2 - 5.1.2
36 Annual Report 2012
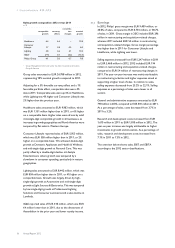
Sales growth composition 2012 versus 2011
in %
comparable
growth
currency
effects
consolida-
tion
changes
nominal
growth
Healthcare 6.4 6.4 − 12.8
Consumer
Lifestyle 1.7 3.8 0.5 6.0
Lighting 3.8 4.6 2.1 10.5
IG&S1) (7.4) 0.1 (6.2) (13.5)
Philips Group 4.1 5.0 0.7 9.8
1) Group Management & Services sector has been renamed to Innovation,
Group & Services
Group sales amounted to EUR 24,788 million in 2012,
representing 10% nominal growth compared to 2011.
Adjusting for a 5% favorable currency effect and a 1%
favorable portfolio effect, comparable sales were 4%
above 2011. Comparable sales were up 6% at Healthcare,
while Lighting was 4% higher and Consumer Lifestyle was
2% higher than the previous year.
Healthcare sales amounted to EUR 9,983 million, which
was EUR 1,131 million higher than in 2011, or 6% higher
on a comparable basis. Higher sales were driven by solid
mid-single-digit comparable growth in all businesses, as
increases in growth geographies and North America were
tempered by flat sales in Western Europe.
Consumer Lifestyle reported sales of EUR 5,953 million,
which was EUR 338 million higher than in 2011, or 2%
higher on a comparable basis. We achieved double-digit
growth at Domestic Appliances and Health & Wellness
and mid-single-digit growth at Personal Care. This was
partly offset by a double-digit decline at Lifestyle
Entertainment, where growth was tempered by a
slowdown in consumer spending, particularly in mature
geographies.
Lighting sales amounted to EUR 8,442 million, which was
EUR 804 million higher than in 2011, or 4% higher on a
comparable basis. Growth was largely driven by high-
single-digit growth at Automotive and mid-single-digit
growth at Light Sources & Electronics. This was tempered
by low-single-digit growth at Professional Lighting
Solutions and Consumer Luminaires and a sales decline at
Lumileds.
IG&S reported sales of EUR 410 million, which was EUR
64 million lower than in 2011, due to the divestment of
Assembléon in the prior year and lower royalty income.
5.1.2 Earnings
In 2012, Philips’ gross margin was EUR 9,409 million, or
38.0% of sales, compared to EUR 8,734 million, or 38.7%
of sales, in 2011. Gross margin in 2012 included EUR 296
million in restructuring and acquisition-related charges,
whereas 2011 included EUR 53 million in restructuring
and acquisition-related charges. Gross margin percentage
was higher than in 2011 for Consumer Lifestyle and
Healthcare, while Lighting was lower.
Selling expenses increased from EUR 5,247 million in 2011
to EUR 5,468 million in 2012. 2012 included EUR 194
million in restructuring and acquisition-related charges,
compared to EUR 54 million of restructuring charges in
2011. The year-on-year increase was mainly attributable
to restructuring activities and higher expenses aimed at
supporting a higher level of sales. In relation to sales,
selling expenses decreased from 23.2% to 22.1%. Selling
expenses as a percentage of sales were lower in all
sectors.
General and administrative expenses amounted to EUR
798 million in 2012, compared to EUR 841 million in 2011.
As a percentage of sales, costs decreased from 3.7% in
2011 to 3.2%.
Research and development costs increased from EUR
1,610 million in 2011 to EUR 1,810 million in 2012. The
year-on-year increase was largely attributable to higher
investments in growth and innovation. As a percentage of
sales, research and development costs increased from
7.1% in 2011 to 7.3% in 2012.
The overview below shows sales, EBIT and EBITA
according to the 2012 sector classifications.